CETYCETYIndustrials · Specialty Industrial Machinery

CETY Stock Forecast: Clean Energy Technologies, Inc. Price Predictions for 2026-2027

Last close, 4 Nov 2026
$0.86
−4.47% on the day

Ticker Nerd's systematic factor model, run across ~4,600 US stocks, ranks it 15 of 100 as at 3 Nov 2026 — in the weakest quartile.

Market cap
$10.9M
Ticker Nerd rank
15/ 100
Median analyst target
—
Analysts covering
0
Revenue$372K+57.4% y/y
Operating income−$756K
Net income−$1.1M
Free cash flow−$828K
Quarterly, 8 quarters to 30 June 2026 · latest quarter's figure shown
Total return, dividends reinvested
1W
−6.7%
1M
−12.3%
YTD
+17.9%
1Y
−44.1%
From 52W high
−63.1%
From 52W low
+84.3%
$0.46
$2.32
52-week range, adjusted closes · the dot is the last close
Ticker Nerd rank

CETY stock analysis: one number for the whole business

Consensus tells you what everyone already believes. The model scores Clean Energy Technologies, Inc. on its factor families — the same systematic rank behind the Ticker Nerd portfolio.

Where the model ranks itAs at 3 Nov 2026
15/ 100

Percentile across ~4,600 US stocks on Ticker Nerd’s systematic factor model. Higher is better. How the model is built and tested

Size
91
Growth
49
Issuance
43
Volatility
26
Accruals
25
Revisions
25
Momentum
24
Quality
22
Value
7

Size (91): Smaller than most of the companies we track.

Value (7): The shares cost a lot relative to the profits and assets behind them.

Built and run by Aslam Ghouse, an ex-Goldman Sachs systematic trader with 15+ years in markets.

Wall Street

CETY stock forecast 2026-2027: analyst price targets & predictions

The bullish and bearish analyst opinions on CETY, reported as data — targets and ratings, the market's view beside the model's.

Share price and the analyst range, 12 monthsAdjusted close, US dollars
$0.50$1.00$1.50$2.00$2.50Jan 26Apr 26Jul 26Oct 26CETY

Price targets and ratings are third-party analyst estimates, reported here as data. They are not Ticker Nerd forecasts, and they are frequently wrong.

Data provided by Twelve Data

Price targets and ratings are third-party analyst estimates, reported here as data. They are not Ticker Nerd forecasts, and they are frequently wrong.

Market Radar

This page is one stock. Monday covers all of them.

CETY appears in the Radar on the weeks it earns a place.

  • Market Radar, every Monday: the week's biggest rank moves across ~4,600 US stocks, and the reason for each.
  • The AI build-out map, free: every AI company we track, part by part, and one part in full with each verdict.

Free. Unsubscribe any time.

The AI build-out map
PDF
  • AI cloud capacity

    MSFTAMZNGOOGLORCL

  • AI chips

    NVDAAVGOAMDMU

  • AI networking and serversIn full

    ANETDELLLITECRDO

  • Data centre power

    VRTCEGGEVVST

Performance

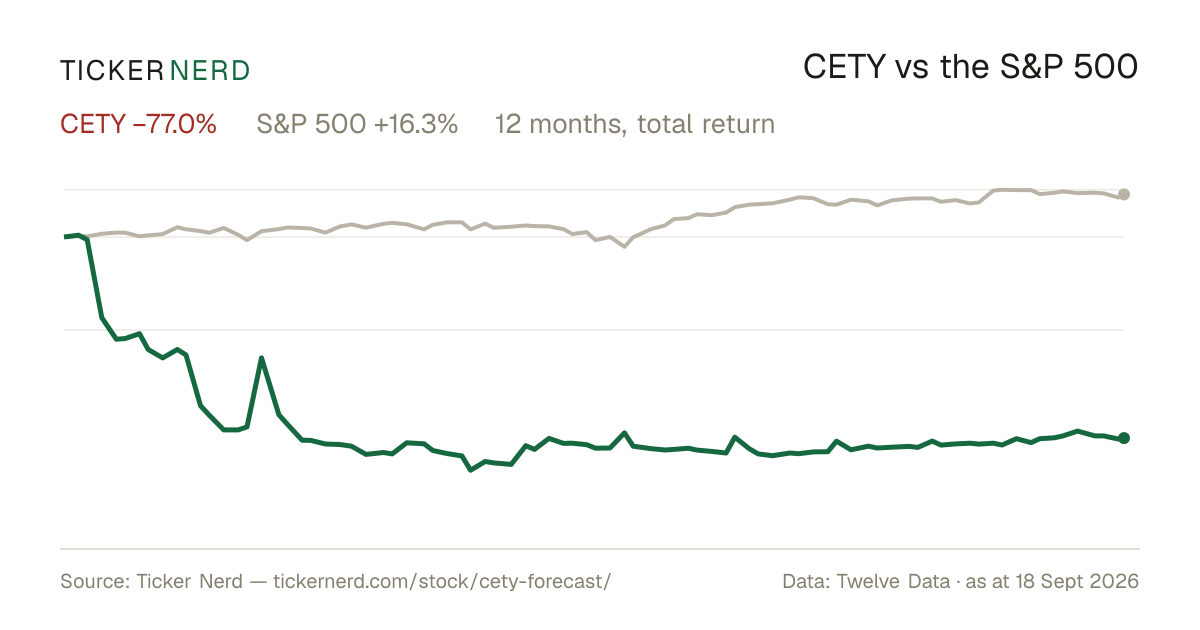
CETY vs the S&P 500

Both lines are total return — dividends reinvested — so the comparison is honest on both sides.

Over the twelve months to 4 Nov 2026, Clean Energy Technologies, Inc. returned −44.1% against +14.8% for the S&P 500, dividends included.

CETY vs S&P 500, last 12 monthsTotal return, rebased to 100
406080100120140160Jan 26Apr 26Jul 26Oct 26CETYS&P 500

Download this chart as an image — free to reuse; link this page as the source.

Data provided by Twelve Data

Estimates

CETY analyst estimate revisions

Not the forecast itself — the direction analysts are revising it. Revision direction is one of the model's factor families.

Fundamentals

Clean Energy Technologies, Inc. (CETY) financial data

A margin means little on its own. Each bar marks where the figure sits across the whole US universe we score.

Valuation
Trailing P/E
0.3×

Cheaper than 72% of US stocks

Price / sales
4.1×

Cheaper than 28% of US stocks

Price / book
1.8×

Cheaper than 46% of US stocks

EV / EBITDA
−5.0×

Cheaper than 81% of US stocks

Growth & margins
Revenue growth (YoY)
57.4%

Higher than 88% of US stocks

Earnings growth (YoY)
—
Gross margin
4.7%

Higher than 6% of US stocks

Operating margin
−203.3%

Higher than 11% of US stocks

Net margin
−259.3%

Higher than 1% of US stocks

Returns & dividend
Return on equity
−99.6%

Higher than 13% of US stocks

Return on assets
−12.6%

Higher than 25% of US stocks

Dividend yield
0.0%

Higher than 1% of US dividend payers

Bars mark the percentile across the ~4,600 US stocks Ticker Nerd covers, among those reporting the figure.

Key statistics

Clean Energy Technologies, Inc. (CETY) statistics: revenue, profit & scale

The headline figures, each with its date. Every row carries its own link — cite it straight from here.

  • Clean Energy Technologies, Inc. has a market value of $10.9M and an enterprise value of $14.6M.

  • Revenue in the twelve months to 30 June 2026: $1.5M. The latest quarter grew 57.4% year on year.

  • Net income over the same four quarters: −$7.0M, a −466.2% net margin.

  • Free cash flow in the twelve months to 30 June 2026: −$8.0M.

  • Shares outstanding: 12.2M.

  • Trailing P/E: 0.3×.

  • Forward dividend yield: 0.00%, paying out 0% of earnings.

  • Clean Energy Technologies, Inc. employs 25 people — $60K of revenue per employee.

Statement figures: company filings via Twelve Data, four quarters to 30 June 2026 · market figures as at 4 Nov 2026

Data provided by Twelve Data

Peers

CETY vs competitors

The nearest names by industry and size, scored by the same model — like for like.

Its peer group, ranked by the same modelSpecialty Industrial Machinery
CompanyMarket capTKN rank
CETYClean Energy Technologies, Inc.$10.9M15
HUHUHUHUTECH International Group, Inc.$11.0M23
JCSEJE Cleantech Holdings Ltd.$8.6M94
WFFW.F Holding Ltd.$7.8M13
SPPLSimpple Ltd.$24.0M16
CVVCVD Equipment Corp.$26.8M37
OPTTOcean Power Technologies, Inc.$4.1M12

Look up any of the roughly 4,600 stocks we score.

The rank is the raw material. Whether the rules would actually own Clean Energy Technologies, Inc. — and when they’d sell — is the membership. See the Ticker Nerd 20 →

News

Latest CETY news & analysis

Pulp Mill Closure Incentivizes Developing Alternative Vermont Forestry Markets

GlobeNewsWire · 4 Aug 2026positive

Finch Paper announced it will close its pulp mill in Glens Falls, New York. The announcement underscores the urgent need for alternative solutions capable of utilizing low-grade wood and forestry waste across Vermont and the Northeastern US, according to the release.

Why it matters — CETY watchers would care because the mill closure highlights growing demand for alternative technologies that can make use of low-grade wood and forestry waste in the region.

FAQ

Frequently asked questions about CETY stock

How does Ticker Nerd's model rank CETY?

As at 3 Nov 2026, Clean Energy Technologies, Inc. ranks 15 out of 100 on Ticker Nerd's systematic factor model — a percentile across roughly 4,600 US stocks, built from its factor families. Its strongest factor family is Size (91 of 100).

What is the CETY stock forecast for 2030?

No analyst covering Clean Energy Technologies, Inc. publishes a 2030 price target — Wall Street targets run 12 to 18 months out. Sites quoting a 2030 price for CETY are extrapolating price history, which says nothing about the business.

How has CETY stock performed over the past year?

Clean Energy Technologies, Inc. returned -44.1% over the 12 months to 4 Nov 2026, with dividends reinvested. Past performance does not indicate future returns.

What does Clean Energy Technologies, Inc. do?

Clean Energy Technologies, Inc. is a clean energy technology company that develops and markets products and integrated solutions focused on energy efficiency and renewable power.

What is the latest news on CETY?

The most recent item we track (GlobeNewsWire, 4 Aug 2026): "Pulp Mill Closure Incentivizes Developing Alternative Vermont Forestry Markets". Finch Paper announced it will close its pulp mill in Glens Falls, New York. The announcement underscores the urgent need for alternative solutions capable of utilizing low-grade wood and forestry waste across Vermont and the Northeastern US, according to the release.

Company

About Clean Energy Technologies, Inc.

Clean Energy Technologies, Inc. is a clean energy technology company that develops and markets products and integrated solutions focused on energy efficiency and renewable power. Its core offerings include waste heat recovery systems, renewable natural gas and waste-to-energy solutions, and engineering and manufacturing services that support energy-related applications. The company’s principal product, the Clean Cycle generator, captures wasted heat and converts it into electricity, while other solutions help transform waste materials from manufacturing, agriculture, and wastewater treatment into electricity, hydrogen, renewable natural gas, and biochar. Clean Energy Technologies, Inc. serves industrial and infrastructure-oriented customers across North America, Europe, and Asia, with activities spanning heat recovery, consulting, project execution, and electronics manufacturing. Based in Irvine, California, Clean Energy Technologies, Inc. plays a niche role in distributed clean power and resource-recovery markets.

CEO Mr. Kambiz Mahdi · 25 employees · United States · https://www.cetyinc.com