DBRGDBRGFinancial Services · Asset Management

DBRG Stock Forecast: DigitalBridge Group, Inc. Price Predictions for 2026-2027

Last close, 14 Aug 2026
$16
+0.06% on the day

The 6 Wall Street analysts covering DigitalBridge Group, Inc. hold a median 12-month price target of $16 — +0.5% from the last close. Ticker Nerd's systematic factor model, run across ~4,600 US stocks, ranks it 78 of 100 as at 15 Aug 2026 — inside the top quartile. Here, the model and the Street point the same way.

Market cap
$2.9B
Ticker Nerd rank
78 / 100
Median analyst target
$16
Analysts covering
6
Total return, dividends reinvested
1W
−0.1%
1M
+1.2%
YTD
+3.9%
1Y
+42.3%
From 52W high
−0.1%
From 52W low
+73.9%
$9
$16
52-week range, adjusted closes · the dot is the last close
Ticker Nerd rank

DBRG stock analysis: one number for the whole business

Consensus tells you what everyone already believes. The model scores DigitalBridge Group, Inc. on its factor families — the same systematic rank behind the Ticker Nerd portfolio.

Where the model ranks itAs at 15 Aug 2026
78 / 100

Percentile across ~4,600 US stocks on Ticker Nerd’s systematic factor model. Higher is better. How the model is built and tested

Growth
99
Momentum
99
Quality
96
Value
85
Volatility
77
Issuance
58
Size
32
Revisions
25
Accruals
20

Growth (99): Sales and profits are climbing, and climbing faster than before.

Accruals (20): A large share of reported profit has not shown up as cash, or the balance sheet is expanding quickly — both tend to unwind.

Built and run by Aslam Ghouse, an ex-Goldman Sachs quant trader with fourteen years in markets.

Wall Street

DBRG stock forecast 2026-2027: analyst price targets & predictions

The bullish and bearish analyst opinions on DBRG, reported as data — targets and ratings, the market's view beside the model's.

Share price and the analyst range, 12 monthsAdjusted close, US dollars
$8$10$12$14$16Oct 25Jan 26Apr 26Jul 26DBRGHigh $16Median $16Low $16

Price targets and ratings are third-party analyst estimates, reported here as data. They are not Ticker Nerd forecasts, and they are frequently wrong.

What Wall Street says6 analysts
1 Buy4 Hold1 Sell
Low $16Median $16High $16

The green dot is the last close — the median target sits +0.5% from it.

Recent analyst actionsNewest first
DateFirmActionRatingTarget
31 Mar 2026Truist SecuritiesAssumesHold$16
27 Jan 2026Raymond JamesDowngradeUnderperform
31 Dec 2025Truist SecuritiesDowngradeHold
30 Dec 2025B. Riley SecuritiesDowngradeNeutral
30 Dec 2025Keefe, Bruyette & WoodsMaintainsMarket Perform
30 Dec 2025RBC CapitalDowngradeSector Perform
30 Dec 2025TD CowenDowngradeHold
29 Dec 2025CitizensDowngradeMarket Perform
8 Dec 2025RBC CapitalMaintainsOutperform
3 Nov 2025Keefe, Bruyette & WoodsMaintainsMarket Perform
31 Oct 2025TD CowenMaintainsBuy
20 Aug 2025Truist SecuritiesMaintainsBuy
12 Aug 2025Keefe, Bruyette & WoodsMaintainsMarket Perform
3 June 2025Truist SecuritiesMaintainsBuy
16 May 2025JMP SecuritiesReiteratesMarket Outperform
6 May 2025Keefe, Bruyette & WoodsMaintainsMarket Perform
25 Mar 2025Truist SecuritiesMaintainsBuy
26 Feb 2025Keefe, Bruyette & WoodsMaintainsMarket Perform
24 Feb 2025Wells FargoMaintainsOverweight
21 Feb 2025Citizens Capital MarketsReiteratesMarket Outperform

Price targets and ratings are third-party analyst estimates, reported here as data. They are not Ticker Nerd forecasts, and they are frequently wrong.

Market Radar

This page is one stock. Monday covers all of them.

Computed off the Friday close and sent before the US open.

Market Radar reports the week’s largest rank changes across roughly 4,600 US stocks, the factor behind each one, and where the market went. DBRG appears on the weeks it earns a place.

Free, every Monday. Unsubscribe any time.

Estimates

DBRG analyst estimate revisions

Not the forecast itself — the direction analysts are revising it. Revision direction is one of the model's factor families.

Which way the estimates are movingNext fiscal year
EPS revision, 90 days
−23.6%
Analysts raising
0
Analysts cutting
0
Fundamentals

DigitalBridge Group, Inc. (DBRG) financial data

A margin means little on its own. Each bar marks where the figure sits across the whole US universe we score.

Valuation
Trailing P/E
10.0×

Cheaper than 59% of US stocks

Price / sales
4.7×

Cheaper than 27% of US stocks

Price / book
1.9×

Cheaper than 48% of US stocks

EV / EBITDA
15.7×

Cheaper than 23% of US stocks

Growth & margins
Revenue growth (YoY)
646.9%

Higher than 98% of US stocks

Earnings growth (YoY)
618.9%

Higher than 96% of US stocks

Gross margin
63.0%

Higher than 77% of US stocks

Operating margin
46.8%

Higher than 95% of US stocks

Net margin
54.3%

Higher than 96% of US stocks

Returns & dividend
Return on equity
10.2%

Higher than 64% of US stocks

Return on assets
3.9%

Higher than 70% of US stocks

Dividend yield
0.3%

Higher than 4% of US dividend payers

Bars mark the percentile across the ~4,600 US stocks Ticker Nerd covers, among those reporting the figure.

Peers

DBRG vs competitors

The nearest names by industry and size, scored by the same model — like for like.

Its peer group, ranked by the same modelAsset Management
CompanyMarket capTKN rank
DBRGDigitalBridge Group, Inc.$2.9B
78
GCMGGCM Grosvenor, Inc.$2.8B
86
AAMIAcadian Asset Management, Inc.$3.3B
97
APAMArtisan Partners Asset Management, Inc.$3.4B
84
WTWisdomTree, Inc.$3.5B
73
CNSCohen & Steers, Inc. (New York)$4.3B
75
PAXPatria Investments Ltd.$1.9B
50

Look up any of the roughly 4,600 stocks we score.

The rank is the raw material. Whether the rules would actually own DigitalBridge Group, Inc. — and when they’d sell — is the membership. See the Ticker Nerd 20 →

News

Latest DBRG news & analysis

DigitalBridge: Strong Earnings, But The Upside Is Capped

Seeking Alpha · 10 Aug 2026negative

DigitalBridge Group, Inc. reported 2Q26 GAAP EPS of $1.16, beating expectations on carried interest and investment income. The pending $16/share SoftBank take-private caps upside and downside, while core fee revenue and FEEUM growth remained muted, fee-related earnings fell 17% YoY, and FRE margins compressed to 30% amid a 19% YoY rise in cash compensation.

Why it matters — For DBRG watchers, the report shifts focus from the company's fundamentals to the SoftBank deal's closure while revealing pressure on the recurring fee-earnings engine.

DigitalBridge Reports Second Quarter 2026 Financial Results

Business Wire · 4 Aug 2026neutral

DigitalBridge Group, Inc. announced its financial results for the second quarter ended June 30, 2026. In light of the proposed transaction with SoftBank Group Corp., and as is customary during the pendency of an acquisition, the company will not host a conference call or provide detailed financial guidance.

Why it matters — DBRG watchers should note that the company is in the pendency period of a proposed SoftBank acquisition, which limits the usual earnings call and guidance.

FAQ

Frequently asked questions about DBRG stock

What is the DBRG stock price forecast for 2026-2027?

The 6 Wall Street analysts covering DigitalBridge Group, Inc. have a median 12-month price target of $16, with estimates ranging from $16 to $16. These are third-party analyst estimates, not Ticker Nerd forecasts, and they are frequently wrong.

Is DBRG stock a buy right now?

Of the 6 analysts covering DigitalBridge Group, Inc., 1 rate it a Buy, 4 a Hold and 1 a Sell. Ticker Nerd's systematic factor model ranks DigitalBridge Group, Inc. 78 out of 100 across roughly 4,600 US stocks as at 15 Aug 2026. None of this is personal advice — it does not consider your circumstances.

How does Ticker Nerd's model rank DBRG?

As at 15 Aug 2026, DigitalBridge Group, Inc. ranks 78 out of 100 on Ticker Nerd's systematic factor model — a percentile across roughly 4,600 US stocks, built from its factor families. Its strongest factor family is Growth (99 of 100).

Will DBRG stock go up?

No one can know that. What the data says: the median 12-month target from 6 analysts implies +0.5% from the last close, and Ticker Nerd's factor model ranks DigitalBridge Group, Inc. 78 out of 100 as at 15 Aug 2026. Analyst targets are third-party estimates and frequently wrong; none of this is personal advice.

What is the DBRG stock forecast for 2030?

No analyst covering DigitalBridge Group, Inc. publishes a 2030 price target — Wall Street targets run 12 to 18 months out. Sites quoting a 2030 price for DBRG are extrapolating price history, which says nothing about the business. The furthest attributed numbers are the current analyst targets: $16 to $16 over the next 12 months.

How has DBRG stock performed over the past year?

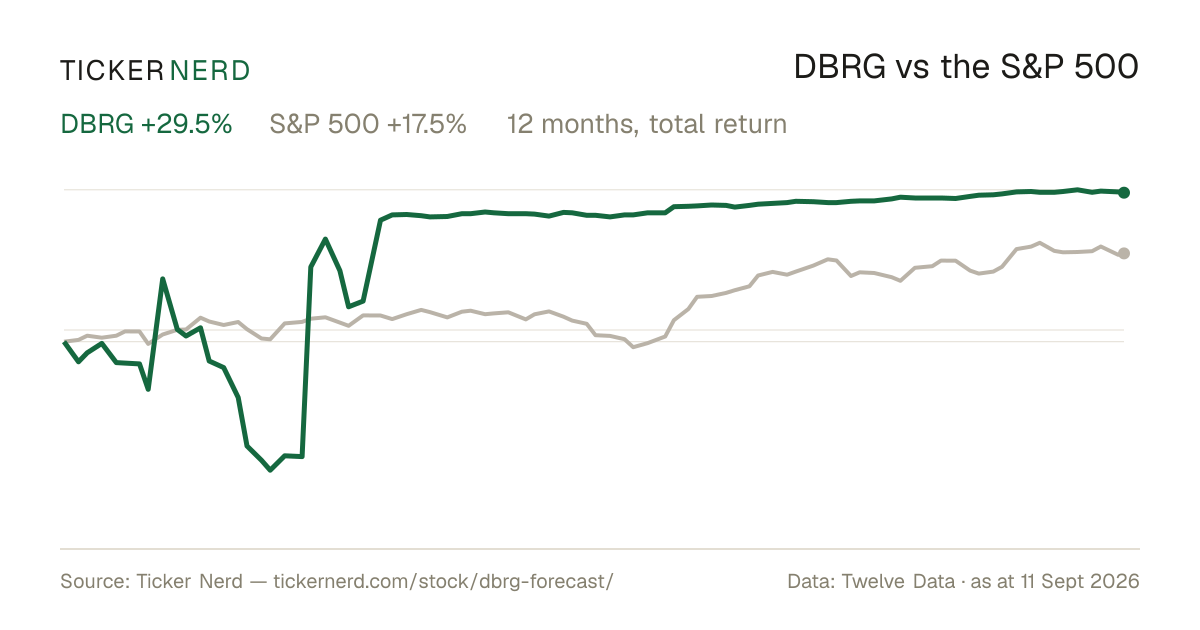
DigitalBridge Group, Inc. returned +42.3% over the 12 months to 14 Aug 2026, with dividends reinvested. Past performance does not indicate future returns.

What does DigitalBridge Group, Inc. do?

DigitalBridge Group Inc. is a global investment firm that focuses on digital infrastructure assets.

What is the latest news on DBRG?

The most recent item we track (Seeking Alpha, 10 Aug 2026): "DigitalBridge: Strong Earnings, But The Upside Is Capped". DigitalBridge Group, Inc. reported 2Q26 GAAP EPS of $1.16, beating expectations on carried interest and investment income. The pending $16/share SoftBank take-private caps upside and downside, while core fee revenue and FEEUM growth remained muted, fee-related earnings fell 17% YoY, and FRE margins compressed to 30% amid a 19% YoY rise in cash compensation.

Company

About DigitalBridge Group, Inc.

DigitalBridge Group Inc. is a global investment firm that focuses on digital infrastructure assets. Its primary function is to own, operate, and invest in a broad spectrum of digital infrastructure, including data centers, cell towers, fiber networks, and small cell networks. The firm plays a significant role in the telecommunications and technology sectors by providing essential infrastructure that supports internet connectivity, cloud services, and the growing demand for data consumption. With a strategy centered on the convergence of digital real estate and technology, DigitalBridge Group Inc. facilitates the seamless operation of networks critical for telecom providers, cloud computing giants, and global enterprises. The company's influence extends across various regions and markets, underlining its pivotal role in the advancement of digital connectivity and communication technology. Originating from its predecessor, Colony Capital Inc., DigitalBridge has evolved to focus exclusively on the rapidly expanding digital infrastructure market, capitalizing on the increasing need for robust and efficient connections in a digital-first world.

CEO Mr. Marc Christopher Ganzi · 303 employees · United States · https://www.digitalbridge.com