EXPEEXPEConsumer Cyclical · Travel Services

EXPE Stock Forecast: Expedia Group, Inc. Price Predictions for 2026-2027

Last close, 14 Aug 2026
$333
+1.33% on the day

The 38 Wall Street analysts covering Expedia Group, Inc. hold a median 12-month price target of $322 — -3.2% from the last close. Ticker Nerd's systematic factor model, run across ~4,600 US stocks, ranks it 100 of 100 as at 15 Aug 2026 — among the strongest tenth. The factors read stronger than the Street's target implies. That gap is the story on this page.

Market cap
$39.9B
Ticker Nerd rank
100 / 100
Median analyst target
$322
Analysts covering
38
Total return, dividends reinvested
1W
+7.1%
1M
+24.9%
YTD
+18.0%
1Y
+61.9%
From 52W high
0.0%
From 52W low
+77.3%
$188
$333
52-week range, adjusted closes · the dot is the last close
Ticker Nerd rank

EXPE stock analysis: one number for the whole business

Consensus tells you what everyone already believes. The model scores Expedia Group, Inc. on its factor families — the same systematic rank behind the Ticker Nerd portfolio.

Where the model ranks itAs at 15 Aug 2026
100 / 100

Percentile across ~4,600 US stocks on Ticker Nerd’s systematic factor model. Higher is better. How the model is built and tested

Issuance
98
Quality
97
Momentum
97
Value
96
Growth
94
Revisions
89
Accruals
85
Volatility
43
Size
6

Issuance (98): The share count has been shrinking and the company is not leaning on new borrowing.

Volatility (43): The share price moves around a lot.

Size (6): Larger than most of the companies we track — more scrutinised, less often mispriced.

Built and run by Aslam Ghouse, an ex-Goldman Sachs quant trader with fourteen years in markets.

Wall Street

EXPE stock forecast 2026-2027: analyst price targets & predictions

The bullish and bearish analyst opinions on EXPE, reported as data — targets and ratings, the market's view beside the model's.

Share price and the analyst range, 12 monthsAdjusted close, US dollars
$200$250$300$350$400Oct 25Jan 26Apr 26Jul 26EXPEHigh $417Median $322Low $245

Price targets and ratings are third-party analyst estimates, reported here as data. They are not Ticker Nerd forecasts, and they are frequently wrong.

What Wall Street says38 analysts
17 Buy20 Hold1 Sell
Low $245Median $322High $417

The green dot is the last close — the median target sits −3.2% from it.

Recent analyst actionsNewest first

Of the 20 most recent actions, 16 moved their price target up and 0 moved it down.

DateFirmActionRatingTarget
12 Aug 2026UBSMaintainsNeutral$322$351
7 Aug 2026SusquehannaMaintainsNeutral$250$315
7 Aug 2026TD CowenMaintainsHold$285$320
7 Aug 2026Wells FargoMaintainsEqual-Weight$303$307
6 Aug 2026B. Riley SecuritiesMaintainsBuy$350$390
6 Aug 2026BarclaysMaintainsEqual-Weight$264$320
6 Aug 2026BenchmarkMaintainsBuy$290$360
6 Aug 2026BTIGMaintainsBuy$330$350
6 Aug 2026Cantor FitzgeraldMaintainsNeutral$255$310
6 Aug 2026Evercore ISI GroupMaintainsOutperform$350$375
6 Aug 2026Piper SandlerReiteratesNeutral$245$325
6 Aug 2026RBC CapitalMaintainsSector Perform$290$330
6 Aug 2026WedbushReiteratesOutperform$334
3 Aug 2026Truist SecuritiesMaintainsHold
3 Aug 2026Truist SecuritiesMaintainsHold$246$309
30 July 2026Morgan StanleyMaintainsEqual-Weight$290$300
30 July 2026Morgan StanleyMaintainsEqual-Weight
30 July 2026UBSMaintainsNeutral$262$322
30 July 2026UBSMaintainsNeutral
22 July 2026BairdMaintainsOutperform$290$294

Price targets and ratings are third-party analyst estimates, reported here as data. They are not Ticker Nerd forecasts, and they are frequently wrong.

Market Radar

This page is one stock. Monday covers all of them.

Computed off the Friday close and sent before the US open.

Market Radar reports the week’s largest rank changes across roughly 4,600 US stocks, the factor behind each one, and where the market went. EXPE appears on the weeks it earns a place.

Free, every Monday. Unsubscribe any time.

Estimates

EXPE analyst estimate revisions

Not the forecast itself — the direction analysts are revising it. Revision direction is one of the model's factor families.

Which way the estimates are movingNext fiscal year
EPS revision, 90 days
+3.3%
Analysts raising
2
Analysts cutting
6
Fundamentals

Expedia Group, Inc. (EXPE) financial data

A margin means little on its own. Each bar marks where the figure sits across the whole US universe we score.

Valuation
Trailing P/E
20.9×

Cheaper than 38% of US stocks

Price / sales
2.5×

Cheaper than 47% of US stocks

Price / book
33.0×

Cheaper than 3% of US stocks

EV / EBITDA
13.8×

Cheaper than 27% of US stocks

Growth & margins
Revenue growth (YoY)
14.0%

Higher than 61% of US stocks

Earnings growth (YoY)
166.1%

Higher than 89% of US stocks

Gross margin
90.7%

Higher than 97% of US stocks

Operating margin
19.0%

Higher than 78% of US stocks

Net margin
13.0%

Higher than 75% of US stocks

Returns & dividend
Return on equity
89.5%

Higher than 96% of US stocks

Return on assets
6.1%

Higher than 82% of US stocks

Dividend yield
0.3%

Higher than 5% of US dividend payers

Bars mark the percentile across the ~4,600 US stocks Ticker Nerd covers, among those reporting the figure.

Peers

EXPE vs competitors

The nearest names by industry and size, scored by the same model — like for like.

Its peer group, ranked by the same modelTravel Services
CompanyMarket capTKN rank
EXPEExpedia Group, Inc.$39.9B
100
CCLCarnival Corp. Ltd.$38.8B
58
VIKViking Holdings Ltd. (Bermuda)$43.7B
60
RCLRoyal Caribbean Group$82.5B
45
ABNBAirbnb, Inc.$109.9B
82
BKNGBooking Holdings, Inc.$165.0B
76
NCLHNorwegian Cruise Line Holdings Ltd.$8.7B
23

Look up any of the roughly 4,600 stocks we score.

The rank is the raw material. Whether the rules would actually own Expedia Group, Inc. — and when they’d sell — is the membership. See the Ticker Nerd 20 →

News

Latest EXPE news & analysis

Expedia Group Q2 Earnings & Revenues Beat Estimates, Increase Y/Y

Zacks Investment Research · 6 Aug 2026positive

Expedia Group reported double-digit growth in Q2 earnings and revenue, surpassing analyst estimates. The results were driven by momentum in its B2B business, strength across its brands, and disciplined cost management.

Why it matters — The earnings and revenue beat indicates solid operational performance and financial health, which EXPE watchers would view as a positive signal for the company's growth trajectory.

Expedia Leans on AI and B2B Growth to Lift Outlook After Strong Q2

PYMNTS · 6 Aug 2026positive

Expedia Group reported a strong second quarter and entered the summer travel season with strong demand, according to its recent earnings call. The company is leaning on artificial intelligence and B2B growth to lift its outlook going forward.

Why it matters — A EXPE watcher would care because the company's strong Q2 results and its focus on AI and B2B expansion signal the drivers behind its updated outlook.

Here's What Key Metrics Tell Us About Expedia (EXPE) Q2 Earnings

Zacks Investment Research · 6 Aug 2026neutral

Zacks Investment Research reviews Expedia's second-quarter 2026 results, noting that key metrics for the quarter ended June 2026 can be compared against Wall Street estimates and year-ago values. The piece highlights how Expedia's top- and bottom-line numbers perform relative to those benchmarks.

Why it matters — Expedia watchers would care because the article examines how the company's key operating metrics stack up against analyst expectations and prior-year performance.

Expedia Group Q2 Earnings Call Highlights

MarketBeat · 6 Aug 2026positive

Expedia Group reported second-quarter results above the high end of its outlook, citing healthy consumer travel demand, continued momentum in its business-to-business segment, and improved marketing efficiency. The company also raised its full-year guidance for gross bookings, revenue, and adjusted EBITDA margin expansion.

Why it matters — A EXPE watcher would care because the company beat its own expectations and raised its full-year outlook, indicating sustained operational strength and improving profitability.

Expedia Group, Inc. (EXPE) Q2 2026 Earnings Call Transcript

Seeking Alpha · 5 Aug 2026neutral

Seeking Alpha published the transcript of Expedia Group, Inc.'s Q2 2026 earnings call. The excerpt provided contains only the headline, so no specific financial figures or management commentary are included.

Why it matters — The earnings call transcript gives Expedia watchers a record of management's discussion of the company's quarterly performance and outlook.

FAQ

Frequently asked questions about EXPE stock

What is the EXPE stock price forecast for 2026-2027?

The 38 Wall Street analysts covering Expedia Group, Inc. have a median 12-month price target of $322, with estimates ranging from $245 to $417. These are third-party analyst estimates, not Ticker Nerd forecasts, and they are frequently wrong.

Is EXPE stock a buy right now?

Of the 38 analysts covering Expedia Group, Inc., 17 rate it a Buy, 20 a Hold and 1 a Sell. Ticker Nerd's systematic factor model ranks Expedia Group, Inc. 100 out of 100 across roughly 4,600 US stocks as at 15 Aug 2026. None of this is personal advice — it does not consider your circumstances.

How does Ticker Nerd's model rank EXPE?

As at 15 Aug 2026, Expedia Group, Inc. ranks 100 out of 100 on Ticker Nerd's systematic factor model — a percentile across roughly 4,600 US stocks, built from its factor families. Its strongest factor family is Issuance (98 of 100).

Will EXPE stock go up?

No one can know that. What the data says: the median 12-month target from 38 analysts implies -3.2% from the last close, and Ticker Nerd's factor model ranks Expedia Group, Inc. 100 out of 100 as at 15 Aug 2026. Analyst targets are third-party estimates and frequently wrong; none of this is personal advice.

What is the EXPE stock forecast for 2030?

No analyst covering Expedia Group, Inc. publishes a 2030 price target — Wall Street targets run 12 to 18 months out. Sites quoting a 2030 price for EXPE are extrapolating price history, which says nothing about the business. The furthest attributed numbers are the current analyst targets: $245 to $417 over the next 12 months.

How has EXPE stock performed over the past year?

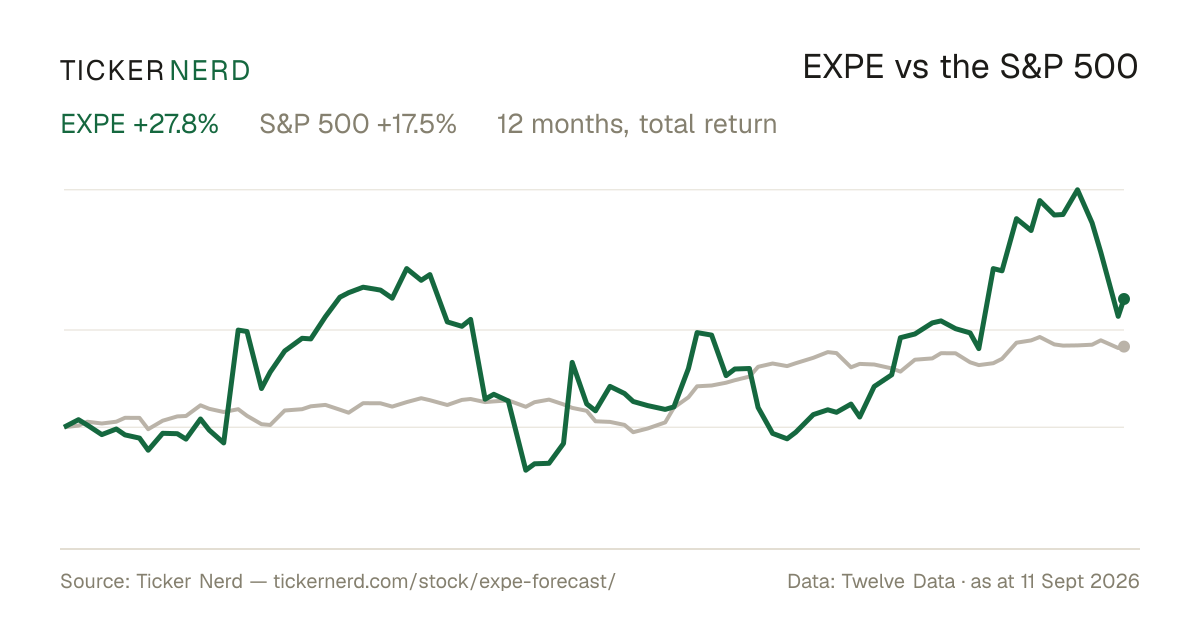
Expedia Group, Inc. returned +61.9% over the 12 months to 14 Aug 2026, with dividends reinvested. Past performance does not indicate future returns.

What does Expedia Group, Inc. do?

Expedia Group, Inc. is a global online travel and travel technology company headquartered in Seattle, Washington.

What is the latest news on EXPE?

The most recent item we track (Zacks Investment Research, 6 Aug 2026): "Expedia Group Q2 Earnings & Revenues Beat Estimates, Increase Y/Y". Expedia Group reported double-digit growth in Q2 earnings and revenue, surpassing analyst estimates. The results were driven by momentum in its B2B business, strength across its brands, and disciplined cost management.

Company

About Expedia Group, Inc.

Expedia Group, Inc. is a global online travel and travel technology company headquartered in Seattle, Washington. It operates a diversified portfolio of consumer and business brands that facilitate the discovery, booking, and management of travel worldwide. Through its flagship brands such as Expedia, Hotels.com, and Vrbo, the company enables travelers to book lodging, flights, car rentals, cruises, and a wide range of destination services and activities, serving both leisure and business customers. Expedia Group also runs a significant B2B operation, providing travel technology, inventory, and booking capabilities to airlines, travel agencies, online retailers, corporate travel managers, and financial institutions, integrating its platform into partners’ offerings. In addition, it owns trivago, a hotel metasearch business that generates advertising revenue by referring users to online travel agencies and hotel providers. Today, Expedia Group plays a central role in the digital travel marketplace, connecting travelers and suppliers through data-driven, multi-brand platforms across many countries and segments.

CEO Ms. Ariane Gorin · 16,000 employees · United States · https://www.expediagroup.com