EXPOEXPOIndustrials · Engineering & Construction

EXPO Stock Forecast: Exponent, Inc. Price Predictions for 2026-2027

Last close, 3 Aug 2026
$68
+2.12% on the day

The 4 Wall Street analysts covering Exponent, Inc. hold a median 12-month price target of $90 — +31.8% from the last close. Ticker Nerd's systematic factor model, run across ~4,600 US stocks, ranks it 84 of 100 as at 1 Aug 2026 — inside the top quartile. Here, the model and the Street point the same way.

Market cap
$3.3B
Ticker Nerd rank
84 / 100
Median analyst target
$90
Analysts covering
4
Total return, dividends reinvested
1W
+8.8%
1M
+12.0%
YTD
−0.8%
1Y
+1.6%
From 52W high
−13.7%
From 52W low
+27.8%
$53
$79
52-week range, adjusted closes · the dot is the last close
Ticker Nerd rank

EXPO stock analysis: one number for the whole business

Consensus tells you what everyone already believes. The model scores Exponent, Inc. on its factor families — the same systematic rank behind the Ticker Nerd portfolio.

Where the model ranks itAs at 1 Aug 2026
84 / 100

Percentile across ~4,600 US stocks on Ticker Nerd’s systematic factor model. Higher is better. How the model is built and tested

Revisions
96
Volatility
83
Issuance
78
Growth
77
Quality
72
Accruals
56
Value
55
Size
30
Momentum
29

Revisions (96): Analysts have, on balance, been raising their forecasts.

Momentum (29): The shares have been drifting down relative to others.

The rank is the raw material. Whether the rules would actually own Exponent, Inc. — and when they’d sell — is the membership.

Wall Street

EXPO stock forecast 2026-2027: analyst price targets & predictions

The bullish and bearish analyst opinions on EXPO, reported as data — targets and ratings, the market's view beside the model's.

Share price and the analyst range, 12 monthsAdjusted close, US dollars
$50$60$70$80$90Oct 25Jan 26Apr 26Jul 26EXPOHigh $90Median $90Low $72

Price targets and ratings are third-party analyst estimates, reported here as data. They are not Ticker Nerd forecasts, and they are frequently wrong.

What Wall Street says4 analysts
3 Buy1 Hold0 Sell
Low $72Median $90High $90

The green dot is the last close — the median target sits +31.8% from it.

Recent analyst actionsNewest first

Of the 20 most recent actions, 1 moved their price target up and 2 moved it down.

DateFirmActionRatingTarget
31 July 2026JP MorganMaintainsOverweight$80$90
31 July 2026UBSMaintainsNeutral$75$72
15 May 2026JP MorganMaintainsOverweight$95$80
15 May 2026JP MorganMaintainsOverweight
1 May 2026UBSMaintainsNeutral
26 Mar 2026JP MorganMaintainsOverweight
26 Jan 2026JP MorganInitiatesOverweight
15 Dec 2025UBSMaintainsNeutral
17 Nov 2025William BlairUpgradeOutperform
26 July 2024Truist SecuritiesReiteratesBuy
29 Apr 2024Truist SecuritiesMaintainsBuy
2 Feb 2024Truist SecuritiesMaintainsBuy
31 July 2023Truist SecuritiesMaintainsBuy
1 June 2023UBSInitiatesNeutral
5 Apr 2022Truist SecuritiesMaintainsBuy
2 Aug 2021Truist SecuritiesMaintainsBuy
2 June 2020Sidoti & Co.MaintainsBuy
13 May 2020Sidoti & Co.UpgradeBuy
1 May 2020Sidoti & Co.MaintainsNeutral
19 Mar 2020Sidoti & Co.UpgradeBuy

Price targets and ratings are third-party analyst estimates, reported here as data. They are not Ticker Nerd forecasts, and they are frequently wrong.

Estimates

EXPO analyst estimate revisions

Not the forecast itself — the direction analysts are revising it. Revision direction is one of the model's factor families.

Which way the estimates are movingNext fiscal year
EPS revision, 90 days
+0.7%
Analysts raising
1
Analysts cutting
2
Fundamentals

Exponent, Inc. (EXPO) financial data

A margin means little on its own. Each bar marks where the figure sits across the whole US universe we score.

Valuation
Trailing P/E
30.6×

Cheaper than 27% of US stocks

Price / sales
5.8×

Cheaper than 22% of US stocks

Price / book
11.5×

Cheaper than 9% of US stocks

EV / EBITDA
23.8×

Cheaper than 12% of US stocks

Growth & margins
Revenue growth (YoY)
12.0%

Higher than 59% of US stocks

Earnings growth (YoY)
10.7%

Higher than 51% of US stocks

Gross margin
Operating margin
18.8%

Higher than 79% of US stocks

Net margin
19.7%

Higher than 82% of US stocks

Returns & dividend
Return on equity
31.2%

Higher than 89% of US stocks

Return on assets
11.3%

Higher than 94% of US stocks

Dividend yield
1.8%

Higher than 42% of US dividend payers

Bars mark the percentile across the ~4,600 US stocks Ticker Nerd covers, among those reporting the figure.

Peers

EXPO vs competitors

The nearest names by industry and size, scored by the same model — like for like.

Its peer group, ranked by the same modelEngineering & Construction
CompanyMarket capTKN rank
EXPOExponent, Inc.$3.3B
84
CDNLCardinal Infrastructure Group, Inc.$2.9B
2
TPCTutor Perini Corp.$4.4B
96
PRIMPrimoris Services Corp.$4.6B
54
KBRKBR, Inc.$4.6B
75
MYRGMYR Group, Inc.$5.2B
100
GVAGranite Construction, Inc.$5.3B
79
Market Radar

This page is one stock. Monday covers all of them.

Computed off the Friday close and sent before the US open.

Market Radar reports the week’s largest rank changes across roughly 4,600 US stocks, the factor behind each one, and where the market went. EXPO appears on the weeks it earns a place.

Free, every Monday. Unsubscribe any time.

News

Latest EXPO news & analysis

Wall Street Analysts Predict a 25.65% Upside in Exponent (EXPO): Here's What You Should Know

Zacks Investment Research · 3 Aug 2026neutral

Zacks Investment Research reported that the average of Wall Street analysts' price targets suggests a potential 25.7% upside for Exponent (EXPO). The article notes the reliability of such metrics is questionable but that positive earnings estimate revisions could support upward movement.

Why it matters — EXPO watchers would care because the article highlights analyst price targets and earnings estimate trends that could signal future stock movement.

Exponent, Inc. (EXPO) Q2 2026 Earnings Call Transcript

Seeking Alpha · 31 July 2026neutral

Exponent, Inc. held its Q2 2026 earnings call, with the transcript published on Seeking Alpha covering management's discussion of the company's quarterly financial results.

Why it matters — The earnings call transcript provides EXPO investors with direct insight into management's commentary on the company's second-quarter performance and outlook.

Exponent Q2 Earnings Call Highlights

MarketBeat · 30 July 2026positive

Exponent reported double-digit revenue and earnings growth for Q2 2026, driven by demand for AI-related user research, utility risk management, and dispute consulting in consumer products, chemicals, and transportation.

Why it matters — The strong quarterly results highlight several growth drivers for Exponent, including AI-related consulting, utility-sector work, and litigation support across multiple industries.

Exponent (EXPO) Surpasses Q2 Earnings and Revenue Estimates

Zacks Investment Research · 30 July 2026positive

Exponent (EXPO) reported quarterly earnings of $0.6 per share, beating the Zacks Consensus Estimate of $0.55 per share, and up from $0.52 per share in the same quarter last year. The company also surpassed revenue estimates for the second quarter.

Why it matters — The earnings beat and year-over-year growth may signal strong operational performance for EXPO in the current quarter.

Exponent Reports Second Quarter 2026 Financial Results

GlobeNewsWire · 30 July 2026neutral

Exponent, Inc. announced its financial results for the second quarter of fiscal year 2026, which ended July 3, 2026. The results were reported in a press release on July 30, 2026.

Why it matters — The quarterly financial results provide investors with a key update on the company's recent performance and financial health.

FAQ

Frequently asked questions about EXPO stock

What is the EXPO stock price forecast for 2026-2027?

The 4 Wall Street analysts covering Exponent, Inc. have a median 12-month price target of $90, with estimates ranging from $72 to $90. These are third-party analyst estimates, not Ticker Nerd forecasts, and they are frequently wrong.

Is EXPO stock a buy right now?

Of the 4 analysts covering Exponent, Inc., 3 rate it a Buy, 1 a Hold and 0 a Sell. Ticker Nerd's systematic factor model ranks Exponent, Inc. 84 out of 100 across roughly 4,600 US stocks as at 1 Aug 2026. None of this is personal advice — it does not consider your circumstances.

How does Ticker Nerd's model rank EXPO?

As at 1 Aug 2026, Exponent, Inc. ranks 84 out of 100 on Ticker Nerd's systematic factor model — a percentile across roughly 4,600 US stocks, built from its factor families. Its strongest factor family is Revisions (96 of 100).

Will EXPO stock go up?

No one can know that. What the data says: the median 12-month target from 4 analysts implies +31.8% from the last close, and Ticker Nerd's factor model ranks Exponent, Inc. 84 out of 100 as at 1 Aug 2026. Analyst targets are third-party estimates and frequently wrong; none of this is personal advice.

What is the EXPO stock forecast for 2030?

No analyst covering Exponent, Inc. publishes a 2030 price target — Wall Street targets run 12 to 18 months out. Sites quoting a 2030 price for EXPO are extrapolating price history, which says nothing about the business. The furthest attributed numbers are the current analyst targets: $72 to $90 over the next 12 months.

How has EXPO stock performed over the past year?

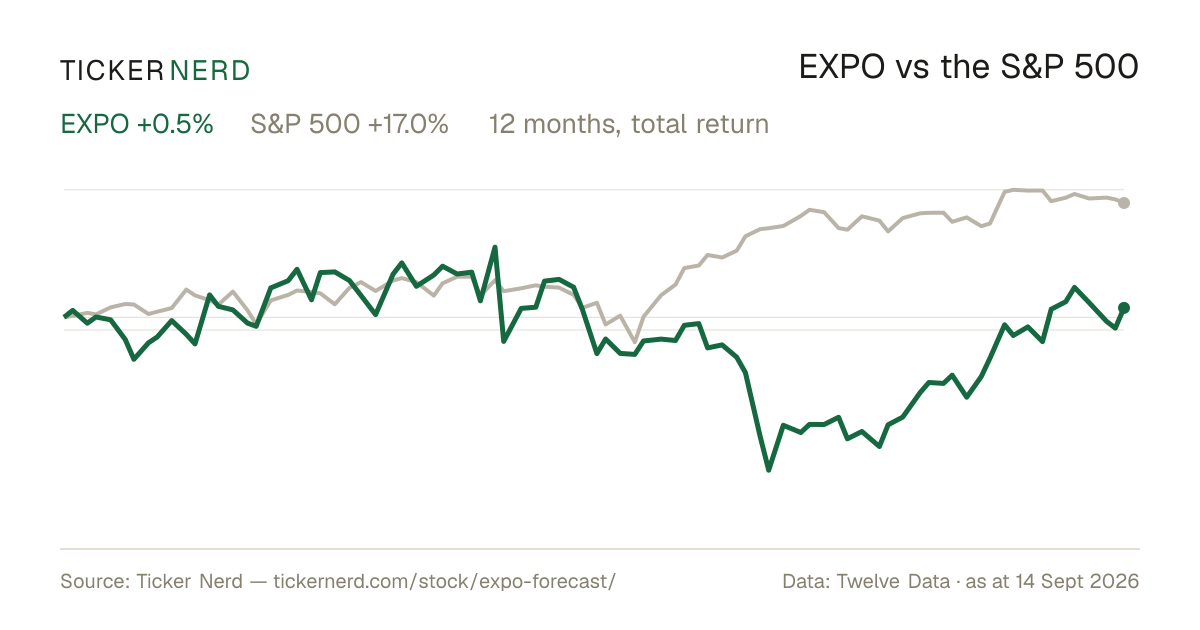
Exponent, Inc. returned +1.6% over the 12 months to 3 Aug 2026, with dividends reinvested. Past performance does not indicate future returns.

What does Exponent, Inc. do?

Exponent Inc. is a consulting firm that specializes in engineering and scientific investigations.

What is the latest news on EXPO?

The most recent item we track (Zacks Investment Research, 3 Aug 2026): "Wall Street Analysts Predict a 25.65% Upside in Exponent (EXPO): Here's What You Should Know". Zacks Investment Research reported that the average of Wall Street analysts' price targets suggests a potential 25.7% upside for Exponent (EXPO). The article notes the reliability of such metrics is questionable but that positive earnings estimate revisions could support upward movement.

Company

About Exponent, Inc.

Exponent Inc. is a consulting firm that specializes in engineering and scientific investigations. Its primary function is to provide comprehensive analysis and solutions for a wide range of complex issues faced by businesses, industries, and government agencies. Notably, Exponent's services span across sectors like infrastructure, energy, and environmental services, offering in-depth expertise in areas such as risk analysis, product safety, and failure analysis. The company plays a pivotal role in supporting innovation and safety standards, helping organizations navigate technological advancements and regulatory requirements. Exponent's multidisciplinary approach, which involves scientists, engineers, and both medical and regulatory specialists, ensures thorough and reliable investigation processes and recommendations. This capability is crucial for entities looking to optimize system performance or comply with demanding industry standards. Exponent Inc.'s market significance is underscored by its extensive portfolio of clients that spans Fortune 500 companies, law firms, governmental bodies, and insurance companies. Founded in 1967, the firm has stood out for its ability to address some of the most challenging technical problems in the world, maintaining a reputation as a leader in knowledge-based consulting services.

CEO Dr. Catherine Ford Corrigan P.E., Ph.D. · 1,212 employees · United States · https://www.exponent.com