GHGHHealthcare · Diagnostics & Research

GH Stock Forecast: Guardant Health, Inc. Price Predictions for 2026-2027

Last close, 7 Oct 2026
$168
−1.38% on the day

The 26 Wall Street analysts covering Guardant Health, Inc. hold a median 12-month price target of $200 — +18.8% from the last close. Ticker Nerd's systematic factor model, run across ~4,600 US stocks, ranks it 51 of 100 as at 6 Oct 2026 — in the upper half.

Market cap
$22.9B
Ticker Nerd rank
51 / 100
Median analyst target
$200
Analysts covering
26
Revenue$335.0M+44.3% y/y
Operating income−$129.1M
Net income−$120.1M
Free cash flow−$69.5M
Quarterly, 8 quarters to 30 June 2026 · latest quarter's figure shown
Total return, dividends reinvested
1W
−5.6%
1M
+4.3%
YTD
+64.8%
1Y
+165.3%
From 52W high
−10.1%
From 52W low
+172.7%
$62
$187
52-week range, adjusted closes · the dot is the last close
Ticker Nerd rank

GH stock analysis: one number for the whole business

Consensus tells you what everyone already believes. The model scores Guardant Health, Inc. on its factor families — the same systematic rank behind the Ticker Nerd portfolio.

Where the model ranks itAs at 6 Oct 2026
51 / 100

Percentile across ~4,600 US stocks on Ticker Nerd’s systematic factor model. Higher is better. How the model is built and tested

Momentum
100
Volatility
75
Growth
63
Quality
60
Revisions
58
Accruals
56
Value
44
Issuance
13
Size
9

Momentum (100): The shares have been drifting up relative to others.

Issuance (13): The company has been issuing shares or taking on financing, diluting existing holders.

Size (9): Larger than most of the companies we track — more scrutinised, less often mispriced.

Built and run by Aslam Ghouse, an ex-Goldman Sachs quant trader with fourteen years in markets.

Wall Street

GH stock forecast 2026-2027: analyst price targets & predictions

The bullish and bearish analyst opinions on GH, reported as data — targets and ratings, the market's view beside the model's.

Share price and the analyst range, 12 monthsAdjusted close, US dollars
$50$100$150$200Jan 26Apr 26Jul 26Oct 26GHHigh $225Median $200Low $105

Price targets and ratings are third-party analyst estimates, reported here as data. They are not Ticker Nerd forecasts, and they are frequently wrong.

Data provided by Twelve Data

What Wall Street says26 analysts
25 Buy0 Hold1 Sell
Low $105Median $200High $225

The green dot is the last close — the median target sits +18.8% from it.

Recent analyst actionsNewest first

Of the 20 most recent actions, 8 moved their price target up and 0 moved it down.

DateFirmActionRatingTarget
1 Oct 2026GuggenheimMaintainsBuy$190 → $200
9 Sept 2026UBSMaintainsBuy—
9 Sept 2026UBSMaintainsBuy$175 → $225
8 Sept 2026Rothschild & CoInitiatesBuy$203
8 Sept 2026Rothschild & CoInitiatesBuy—
2 Sept 2026BTIGReiteratesBuy—
2 Sept 2026BTIGReiteratesBuy$195
4 Aug 2026Morgan StanleyMaintainsOverweight$175 → $185
4 Aug 2026Morgan StanleyMaintainsOverweight—
4 Aug 2026Piper SandlerMaintainsOverweight$135 → $193
4 Aug 2026Piper SandlerMaintainsOverweight—
4 Aug 2026Stephens & Co.MaintainsOverweight$170 → $195
4 Aug 2026Stephens & Co.MaintainsOverweight—
3 Aug 2026StifelMaintainsBuy$130 → $180
3 Aug 2026StifelMaintainsBuy—
31 July 2026BarclaysMaintainsOverweight$150 → $200
31 July 2026BarclaysMaintainsOverweight—
31 July 2026BTIGMaintainsBuy$190 → $195
31 July 2026BTIGMaintainsBuy—
31 July 2026JP MorganMaintainsOverweight—

Price targets and ratings are third-party analyst estimates, reported here as data. They are not Ticker Nerd forecasts, and they are frequently wrong.

Market Radar

This page is one stock. Monday covers all of them.

Computed off the Friday close and sent before the US open.

Market Radar reports the week’s largest rank changes across roughly 4,600 US stocks, the factor behind each one, and where the market went. GH appears on the weeks it earns a place.

Free, every Monday. Unsubscribe any time.

Performance

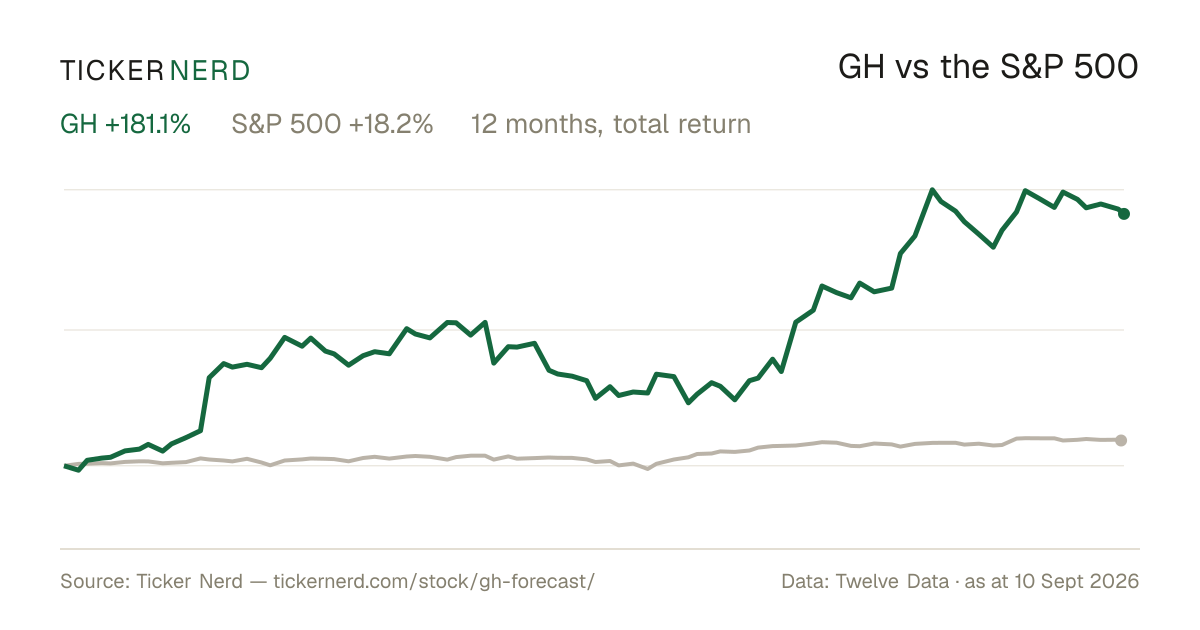
GH vs the S&P 500

Both lines are total return — dividends reinvested — so the comparison is honest on both sides.

Over the twelve months to 7 Oct 2026, Guardant Health, Inc. returned +165.3% against +17.4% for the S&P 500, dividends included.

GH vs S&P 500, last 12 monthsTotal return, rebased to 100
100150200250300Jan 26Apr 26Jul 26Oct 26GHS&P 500

Download this chart as an image — free to reuse; link this page as the source.

Data provided by Twelve Data

Estimates

GH analyst estimate revisions

Not the forecast itself — the direction analysts are revising it. Revision direction is one of the model's factor families.

Which way the estimates are movingNext fiscal year
Analysts raising
0
Analysts cutting
2
Fundamentals

Guardant Health, Inc. (GH) financial data

A margin means little on its own. Each bar marks where the figure sits across the whole US universe we score.

Valuation
Trailing P/E
−51.4×

Cheaper than 98% of US stocks

Price / sales
19.4×

Cheaper than 9% of US stocks

Price / book
−101.8×

Cheaper than 99% of US stocks

EV / EBITDA
−54.7×

Cheaper than 95% of US stocks

Growth & margins
Revenue growth (YoY)
44.3%

Higher than 84% of US stocks

Earnings growth (YoY)
44.3%

Higher than 72% of US stocks

Gross margin
65.4%

Higher than 79% of US stocks

Operating margin
−38.2%

Higher than 18% of US stocks

Net margin
−38.3%

Higher than 12% of US stocks

Returns & dividend
Return on equity
419.2%

Higher than 99% of US stocks

Return on assets
−18.1%

Higher than 21% of US stocks

Dividend yield
0.0%

Bars mark the percentile across the ~4,600 US stocks Ticker Nerd covers, among those reporting the figure.

Key statistics

Guardant Health, Inc. (GH) statistics: revenue, profit & scale

The headline figures, each with its date. Every row carries its own link — cite it straight from here.

  • Guardant Health, Inc. has a market value of $22.9B and an enterprise value of $23.5B.

  • Revenue in the twelve months to 30 June 2026: $1.2B. The latest quarter grew 44.3% year on year.

  • Net income over the same four quarters: −$453.4M, a −38.3% net margin.

  • Diluted earnings per share, trailing twelve months: $−3.49.

  • Free cash flow in the twelve months to 30 June 2026: −$240.7M.

  • Guardant Health, Inc. spent $0.0 on share buybacks in the twelve months to 30 June 2026.

  • Shares outstanding: 133.6M.

  • Trailing P/E: −51.4×; forward P/E: −408.4× — the forward figure prices analyst consensus estimates, not reported earnings.

  • Forward dividend yield: 0.00%, paying out 0% of earnings.

  • Guardant Health, Inc. employs 2,490 people — $475K of revenue per employee.

Statement figures: company filings via Twelve Data, four quarters to 30 June 2026 · market figures as at 7 Oct 2026

Data provided by Twelve Data

Peers

GH vs competitors

The nearest names by industry and size, scored by the same model — like for like.

Its peer group, ranked by the same modelDiagnostics & Research
CompanyMarket capTKN rank
GHGuardant Health, Inc.$22.9B
51
DGXQuest Diagnostics, Inc.$25.4B
93
LHLabcorp Holdings, Inc.$25.8B
86
MEDPMedpace Holdings, Inc.$17.2B
96
RVTYRevvity, Inc.$17.1B
94
MTDMettler-Toledo International, Inc.$31.3B
91
CRLCharles River Laboratories International, Inc.$15.0B
86

Look up any of the roughly 4,600 stocks we score.

The rank is the raw material. Whether the rules would actually own Guardant Health, Inc. — and when they’d sell — is the membership. See the Ticker Nerd 20 →

News

Latest GH news & analysis

Guardant Health (GH) Price Forecast: Breakout Opens Path Toward $250

FXEmpire · 5 Oct 2026positive

Guardant Health reached record highs as bullish chart patterns aligned across multiple timeframes, creating the potential for further upside if buyers hold key breakout support levels. The move follows a technical breakout in the stock's price.

Why it matters — A record-high technical breakout with bullish patterns across timeframes signals strengthening momentum in the stock, which would be relevant for those tracking Guardant Health's price action.

Guardant Health COSMOS Study Published in Cancer Research Communications Validates Utility of Guardant Reveal™ Liquid Biopsy Test for Predicting Recurrence in Melanoma

Business Wire · 5 Oct 2026positive

Guardant Health announced that Cancer Research Communications, a journal of the American Association for Cancer Research, published results from the COSMOS-MEL01 study validating the Guardant Reveal liquid biopsy test for molecular residual disease detection and recurrence monitoring in melanoma patients. It is the first published prospective, multicenter evaluation of the tissue-free, epigenomic blood test in this setting.

Why it matters — Publication of prospective, multicenter validation data in a peer-reviewed journal supports the clinical utility and credibility of Guardant Reveal's use for recurrence monitoring in melanoma, broadening the test's potential applications.

The Top HealthTech Questions Landing on Our Desks

ETF Trends · 30 Sept 2026neutral

ETF Trends published a guide addressing common questions about its Healthcare Technology and Innovation Index (HTEC), prompted by strong healthtech sector performance over the past two quarters and renewed investor interest in medical innovation.

Why it matters — A GH watcher would care because the article reflects increased market attention on the broader healthtech sector, which includes companies like Guardant Health.

FDA advisers are reviewing a multicancer-detection test. Medicare coverage could follow.

Market Watch · 23 Sept 2026neutral

FDA advisers are reviewing Grail's Galleri multicancer-detection test, which screens for 50 cancers from a blood draw. A major study failed to demonstrate the test could detect later-stage cancers, and Medicare coverage could follow depending on the review outcome.

Why it matters — GH watchers would track this review because the Galleri test is a competing product in the cancer-detection space, and its regulatory and coverage path could affect the market landscape for Guardant Health.

AI-Fueled Precision Oncology Firm Guardant Health Is In Focus. Here's Why.

Investors Business Daily · 21 Sept 2026positive

Guardant Health, an AI-fueled precision oncology firm, has earned a spot on the IBD Leaderboard and IBD 50. The company's stock is undergoing a breakout test following this recognition.

Why it matters — This recognition places Guardant Health under closer scrutiny among stock watchers, suggesting its technical position and fundamentals are drawing attention.

FAQ

Frequently asked questions about GH stock

What is the GH stock price forecast for 2026-2027?

The 26 Wall Street analysts covering Guardant Health, Inc. have a median 12-month price target of $200, with estimates ranging from $105 to $225. These are third-party analyst estimates, not Ticker Nerd forecasts, and they are frequently wrong.

Is GH stock a buy right now?

Of the 26 analysts covering Guardant Health, Inc., 25 rate it a Buy, 0 a Hold and 1 a Sell. Ticker Nerd's systematic factor model ranks Guardant Health, Inc. 51 out of 100 across roughly 4,600 US stocks as at 6 Oct 2026. None of this is personal advice — it does not consider your circumstances.

How does Ticker Nerd's model rank GH?

As at 6 Oct 2026, Guardant Health, Inc. ranks 51 out of 100 on Ticker Nerd's systematic factor model — a percentile across roughly 4,600 US stocks, built from its factor families. Its strongest factor family is Momentum (100 of 100).

Will GH stock go up?

No one can know that. What the data says: the median 12-month target from 26 analysts implies +18.8% from the last close, and Ticker Nerd's factor model ranks Guardant Health, Inc. 51 out of 100 as at 6 Oct 2026. Analyst targets are third-party estimates and frequently wrong; none of this is personal advice.

What is the GH stock forecast for 2030?

No analyst covering Guardant Health, Inc. publishes a 2030 price target — Wall Street targets run 12 to 18 months out. Sites quoting a 2030 price for GH are extrapolating price history, which says nothing about the business. The furthest attributed numbers are the current analyst targets: $105 to $225 over the next 12 months.

How has GH stock performed over the past year?

Guardant Health, Inc. returned +165.3% over the 12 months to 7 Oct 2026, with dividends reinvested. Past performance does not indicate future returns.

What does Guardant Health, Inc. do?

Guardant Health Inc. is a precision oncology company that develops blood- and tissue-based tests, data sets, and analytics to support cancer detection and treatment decisions.

What is the latest news on GH?

The most recent item we track (FXEmpire, 5 Oct 2026): "Guardant Health (GH) Price Forecast: Breakout Opens Path Toward $250". Guardant Health reached record highs as bullish chart patterns aligned across multiple timeframes, creating the potential for further upside if buyers hold key breakout support levels. The move follows a technical breakout in the stock's price.

Company

About Guardant Health, Inc.

Guardant Health Inc. is a precision oncology company that develops blood- and tissue-based tests, data sets, and analytics to support cancer detection and treatment decisions. Its product portfolio includes liquid biopsy tests for tumor mutation profiling, molecular residual disease monitoring, tissue-based genomic profiling, and colorectal cancer screening. The company’s solutions are used across clinical care and research settings to help identify biomarkers, track recurrence, and provide molecular insights from tumor-derived material. Guardant Health serves healthcare providers, laboratories, researchers, and life sciences partners in the United States and internationally, with a focus on noninvasive diagnostics and cancer monitoring. Headquartered in Palo Alto, California, Guardant Health plays a significant role in the growing market for precision medicine and advanced oncology diagnostics.

CEO Dr. Helmy Eltoukhy Ph.D. · 2,490 employees · United States · https://guardanthealth.com