GLIBA Stock Forecast: Liberty Capital Corp. Price Predictions for 2026-2027
The 1 Wall Street analysts covering Liberty Capital Corp. hold a median 12-month price target of $54 — +122.8% from the last close. Ticker Nerd's systematic factor model, run across ~4,600 US stocks, ranks it 22 of 100 as at 1 Aug 2026 — in the weakest quartile. The Street sees upside; the factor read is a caution. That gap is the story on this page.
GLIBA stock analysis: one number for the whole business
Consensus tells you what everyone already believes. The model scores Liberty Capital Corp. on its factor families — the same systematic rank behind the Ticker Nerd portfolio.
Percentile across ~4,600 US stocks on Ticker Nerd’s systematic factor model. Higher is better. How the model is built and tested
Accruals (91): Reported profit is backed by cash, and the company is not expanding recklessly.
Growth (0): Sales and profits are flat, shrinking, or growing more slowly than they were.
The rank is the raw material. Whether the rules would actually own Liberty Capital Corp. — and when they’d sell — is the membership.
GLIBA stock forecast 2026-2027: analyst price targets & predictions
The bullish and bearish analyst opinions on GLIBA, reported as data — targets and ratings, the market's view beside the model's.
Price targets and ratings are third-party analyst estimates, reported here as data. They are not Ticker Nerd forecasts, and they are frequently wrong.
The green dot is the last close — the median target sits +122.8% from it.
Of the 14 most recent actions, 8 moved their price target up and 4 moved it down.
| Date | Firm | Action | Rating | Target |
|---|---|---|---|---|
| 11 Aug 2020 | Benchmark | Maintains | Buy | $91 → $93 |
| 8 May 2020 | B. Riley Securities | Maintains | Buy | $78 → $89 |
| 31 Mar 2020 | B. Riley Securities | Maintains | Buy | $92 → $78 |
| 27 Mar 2020 | Benchmark | Maintains | Buy | $82 → $73 |
| 16 Jan 2020 | B. Riley Securities | Maintains | Buy | $89 → $92 |
| 13 Nov 2019 | Citigroup | Upgrade | Buy | $76 → $80 |
| 12 Nov 2019 | Citigroup | Upgrade | Buy | $80 |
| 28 Oct 2019 | Benchmark | Maintains | Buy | $70 → $79 |
| 4 Oct 2019 | Citigroup | Maintains | Neutral | $63 → $71 |
| 29 Aug 2019 | B. Riley Securities | Reiterates | Buy | $72 → $73 |
| 15 Aug 2019 | Evercore ISI Group | Initiates | Outperform | $70 |
| 29 Mar 2019 | Citigroup | Maintains | Neutral | $55 → $59 |
| 2 Aug 2018 | B. Riley Securities | Maintains | Buy | $70 → $62 |
| 7 May 2018 | Buckingham Research | Maintains | Buy | $76 → $67 |
Price targets and ratings are third-party analyst estimates, reported here as data. They are not Ticker Nerd forecasts, and they are frequently wrong.
GLIBA analyst estimate revisions
Not the forecast itself — the direction analysts are revising it. Revision direction is one of the model's factor families.
Liberty Capital Corp. (GLIBA) financial data
A margin means little on its own. Each bar marks where the figure sits across the whole US universe we score.
- Trailing P/E
- 9.8×
- Price / sales
- 0.9×
- Price / book
- 0.6×
- EV / EBITDA
- 4.4×
Cheaper than 59% of US stocks
Cheaper than 72% of US stocks
Cheaper than 83% of US stocks
Cheaper than 54% of US stocks
- Revenue growth (YoY)
- −3.8%
- Earnings growth (YoY)
- −48.6%
- Gross margin
- 72.4%
- Operating margin
- 12.9%
- Net margin
- −31.5%
Higher than 23% of US stocks
Higher than 10% of US stocks
Higher than 85% of US stocks
Higher than 71% of US stocks
Higher than 13% of US stocks
- Return on equity
- −20.4%
- Return on assets
- 2.9%
- Dividend yield
- —
Higher than 31% of US stocks
Higher than 65% of US stocks
Bars mark the percentile across the ~4,600 US stocks Ticker Nerd covers, among those reporting the figure.
GLIBA vs competitors
The nearest names by industry and size, scored by the same model — like for like.
This page is one stock. Monday covers all of them.
Computed off the Friday close and sent before the US open.
Market Radar reports the week’s largest rank changes across roughly 4,600 US stocks, the factor behind each one, and where the market went. GLIBA appears on the weeks it earns a place.
Frequently asked questions about GLIBA stock
What is the GLIBA stock price forecast for 2026-2027?
The 1 Wall Street analysts covering Liberty Capital Corp. have a median 12-month price target of $54, with estimates ranging from $54 to $54. These are third-party analyst estimates, not Ticker Nerd forecasts, and they are frequently wrong.
Is GLIBA stock a buy right now?
Of the 1 analysts covering Liberty Capital Corp., 1 rate it a Buy, 0 a Hold and 0 a Sell. Ticker Nerd's systematic factor model ranks Liberty Capital Corp. 22 out of 100 across roughly 4,600 US stocks as at 1 Aug 2026. None of this is personal advice — it does not consider your circumstances.
How does Ticker Nerd's model rank GLIBA?
As at 1 Aug 2026, Liberty Capital Corp. ranks 22 out of 100 on Ticker Nerd's systematic factor model — a percentile across roughly 4,600 US stocks, built from its factor families. Its strongest factor family is Accruals (91 of 100).
Will GLIBA stock go up?
No one can know that. What the data says: the median 12-month target from 1 analysts implies +122.8% from the last close, and Ticker Nerd's factor model ranks Liberty Capital Corp. 22 out of 100 as at 1 Aug 2026. Analyst targets are third-party estimates and frequently wrong; none of this is personal advice.
What is the GLIBA stock forecast for 2030?
No analyst covering Liberty Capital Corp. publishes a 2030 price target — Wall Street targets run 12 to 18 months out. Sites quoting a 2030 price for GLIBA are extrapolating price history, which says nothing about the business. The furthest attributed numbers are the current analyst targets: $54 to $54 over the next 12 months.
How has GLIBA stock performed over the past year?
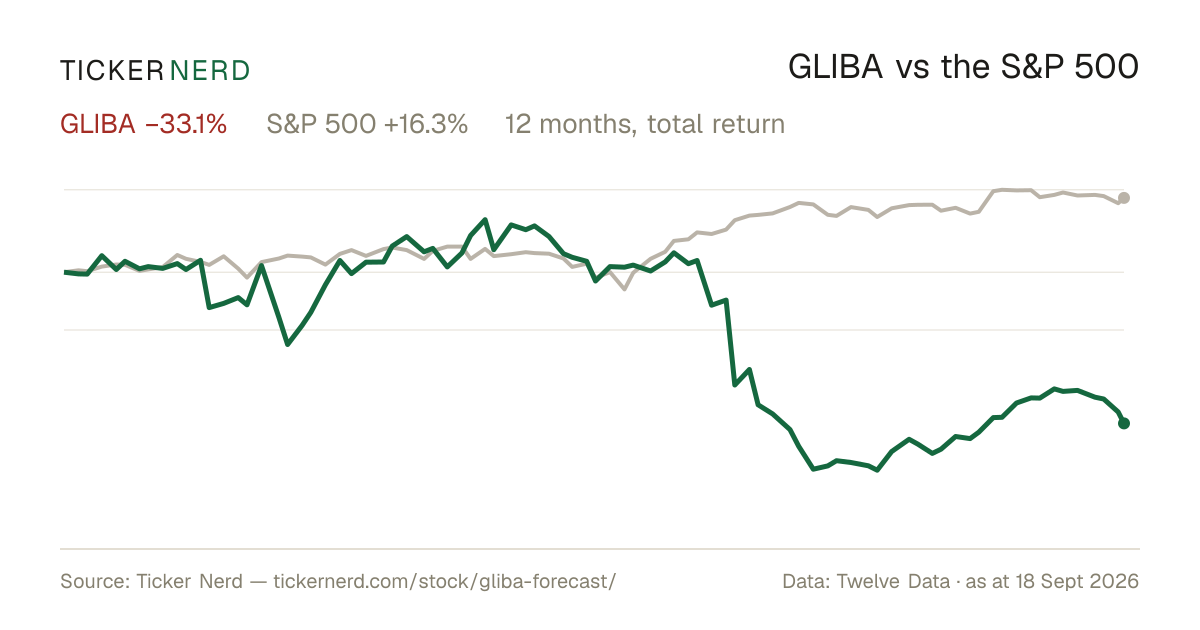
Liberty Capital Corp. returned -26.3% over the 12 months to 3 Aug 2026, with dividends reinvested. Past performance does not indicate future returns.
What does Liberty Capital Corp. do?
GCI Liberty, Inc. Class A Common Stock represents ownership in GCI Liberty, Inc., a company formed as a spin-off from Liberty Broadband Corporation in mid-2025.
About Liberty Capital Corp.
GCI Liberty, Inc. Class A Common Stock represents ownership in GCI Liberty, Inc., a company formed as a spin-off from Liberty Broadband Corporation in mid-2025. GCI Liberty oversees communications businesses including its wholly owned subsidiary GCI, LLC, which is Alaska's largest provider of data, mobile, video, voice, and managed services, serving over 200 communities throughout the state. The company has made significant investments exceeding $4.7 billion over several decades to expand and enhance its Alaska statewide network infrastructure, aiming to improve connectivity and reduce the digital divide. GCI Liberty's diversified portfolio positions it as a key player in regional telecommunications, blending traditional and managed service offerings to consumers, businesses, government entities, and carriers. It operates multiple classes of common stock and maintains public trading status following its spin-off, reflecting its strategic role within the broader Liberty Broadband ecosystem and the communications sector at large.
CEO Mr. Ronald A. Duncan · 1,880 employees · United States · https://www.libertycapitalcorp.com