 GRDXHealthcare · Biotechnology
GRDX Stock Forecast: GridAI Technologies Corp. Price Predictions for 2026-2027
Ticker Nerd's systematic factor model, run across ~4,600 US stocks, ranks it 19 of 100 as at 6 Oct 2026 — in the weakest quartile.
GRDX stock analysis: one number for the whole business
Consensus tells you what everyone already believes. The model scores GridAI Technologies Corp. on its factor families — the same systematic rank behind the Ticker Nerd portfolio.
Percentile across ~4,600 US stocks on Ticker Nerd’s systematic factor model. Higher is better. How the model is built and tested
Accruals (93): Reported profit is backed by cash, and the company is not expanding recklessly.
Value (0): The shares cost a lot relative to the profits and assets behind them.
Built and run by Aslam Ghouse, an ex-Goldman Sachs quant trader with fourteen years in markets.
GRDX stock forecast 2026-2027: analyst price targets & predictions
The bullish and bearish analyst opinions on GRDX, reported as data — targets and ratings, the market's view beside the model's.
Price targets and ratings are third-party analyst estimates, reported here as data. They are not Ticker Nerd forecasts, and they are frequently wrong.
Data provided by Twelve Data
Price targets and ratings are third-party analyst estimates, reported here as data. They are not Ticker Nerd forecasts, and they are frequently wrong.
This page is one stock. Monday covers all of them.
Computed off the Friday close and sent before the US open.
Market Radar reports the week’s largest rank changes across roughly 4,600 US stocks, the factor behind each one, and where the market went. GRDX appears on the weeks it earns a place.
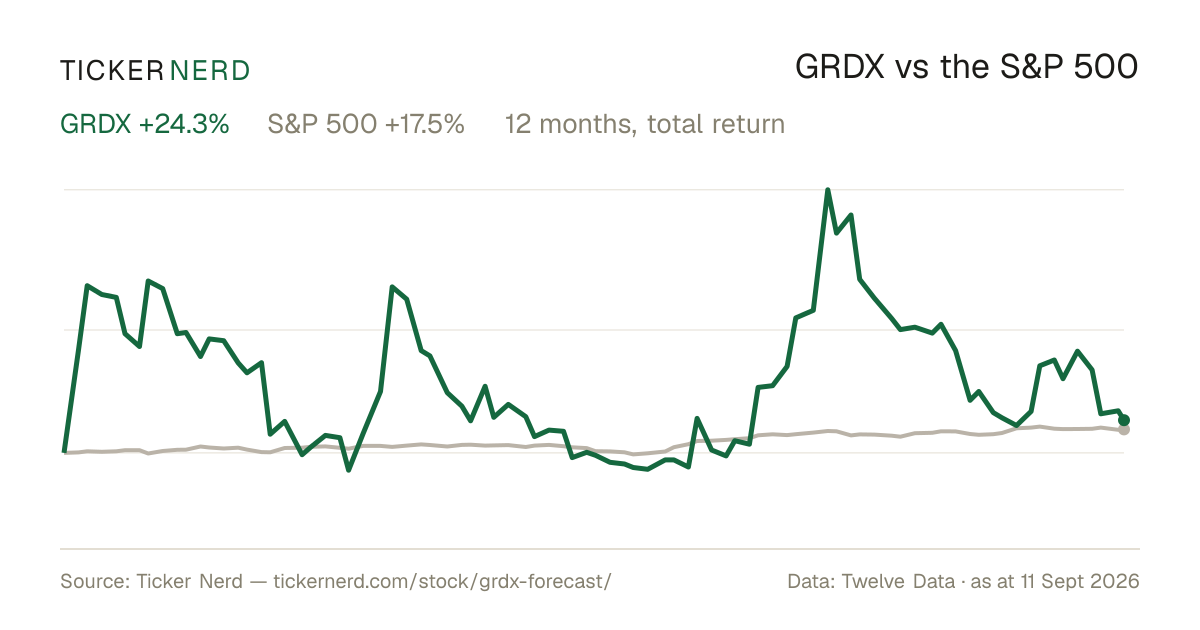
GRDX vs the S&P 500
Both lines are total return — dividends reinvested — so the comparison is honest on both sides.
Over the twelve months to 7 Oct 2026, GridAI Technologies Corp. returned 0.0% against +17.7% for the S&P 500, dividends included.
Download this chart as an image — free to reuse; link this page as the source.
Data provided by Twelve Data
GRDX analyst estimate revisions
Not the forecast itself — the direction analysts are revising it. Revision direction is one of the model's factor families.
GridAI Technologies Corp. (GRDX) financial data
A margin means little on its own. Each bar marks where the figure sits across the whole US universe we score.
- Trailing P/E
- −1.0×
- Price / sales
- 753.4×
- Price / book
- 1.4×
- EV / EBITDA
- −4.4×
Cheaper than 83% of US stocks
Cheaper than 1% of US stocks
Cheaper than 56% of US stocks
Cheaper than 79% of US stocks
- Revenue growth (YoY)
- 124.8%
- Earnings growth (YoY)
- —
- Gross margin
- −42.5%
- Operating margin
- −19540.0%
- Net margin
- −1813.6%
Higher than 94% of US stocks
Higher than 2% of US stocks
Higher than 1% of US stocks
Higher than 1% of US stocks
- Return on equity
- −23.3%
- Return on assets
- −13.9%
- Dividend yield
- 0.0%
Higher than 30% of US stocks
Higher than 23% of US stocks
Higher than 1% of US dividend payers
Bars mark the percentile across the ~4,600 US stocks Ticker Nerd covers, among those reporting the figure.
GridAI Technologies Corp. (GRDX) statistics: revenue, profit & scale
The headline figures, each with its date. Every row carries its own link — cite it straight from here.
GridAI Technologies Corp. has a market value of $27.3M and an enterprise value of $28.7M.
Revenue in the twelve months to 30 June 2026: $160K. The latest quarter grew 124.8% year on year.
Net income over the same four quarters: −$20.8M, a −12957.0% net margin.
Free cash flow in the twelve months to 30 June 2026: −$8.1M.
Trailing P/E: −1.0×.
Forward dividend yield: 0.00%, paying out 0% of earnings.
GridAI Technologies Corp. employs 0 people.
Data provided by Twelve Data
GRDX vs competitors
The nearest names by industry and size, scored by the same model — like for like.
Look up any of the roughly 4,600 stocks we score.
The rank is the raw material. Whether the rules would actually own GridAI Technologies Corp. — and when they’d sell — is the membership. See the Ticker Nerd 20 →
Frequently asked questions about GRDX stock
How does Ticker Nerd's model rank GRDX?
As at 6 Oct 2026, GridAI Technologies Corp. ranks 19 out of 100 on Ticker Nerd's systematic factor model — a percentile across roughly 4,600 US stocks, built from its factor families. Its strongest factor family is Accruals (93 of 100).
What is the GRDX stock forecast for 2030?
No analyst covering GridAI Technologies Corp. publishes a 2030 price target — Wall Street targets run 12 to 18 months out. Sites quoting a 2030 price for GRDX are extrapolating price history, which says nothing about the business.
How has GRDX stock performed over the past year?
GridAI Technologies Corp. returned +0.0% over the 12 months to 7 Oct 2026, with dividends reinvested. Past performance does not indicate future returns.
What does GridAI Technologies Corp. do?
GridAI Technologies Corp. is a technology company focused on intelligent energy orchestration software for utilities, retail energy providers, large power users, and hyperscale AI data center operations.
About GridAI Technologies Corp.
GridAI Technologies Corp. is a technology company focused on intelligent energy orchestration software for utilities, retail energy providers, large power users, and hyperscale AI data center operations. GridAI Technologies Corp. develops a grid-edge platform that uses artificial intelligence, machine learning, IoT, and edge analytics to forecast demand, optimize load, and dispatch distributed energy resources such as battery storage systems and flexible demand assets. Its software is designed to help customers manage complex power environments in real time, improving coordination across devices, fleets, and grid-scale resources. The company also maintains a legacy biopharmaceutical segment centered on targeted, non-systemic therapies for gastrointestinal diseases. Headquartered in Boca Raton, Florida, GridAI Technologies Corp. operates at the intersection of energy infrastructure, software, and life sciences, serving markets where reliable power management and operational efficiency are increasingly important.
CEO Mr. Jason David Sawyer · United Kingdom · https://www.grid-ai.com