HOODHOODFinancial Services · Capital Markets

HOOD Stock Forecast: Robinhood Markets, Inc. Price Predictions for 2026-2027

Last close, 2 Sept 2026
$107
+3.39% on the day

The 28 Wall Street analysts covering Robinhood Markets, Inc. hold a median 12-month price target of $124 — +15.9% from the last close. Ticker Nerd's systematic factor model, run across ~4,600 US stocks, ranks it 54 of 100 as at 1 Sept 2026 — in the upper half.

Market cap
$93.1B
Ticker Nerd rank
54 / 100
Median analyst target
$124
Analysts covering
28
Revenue$1.3B+32.3% y/y
Operating income$574.0M
Net income$573.0M
Free cash flow$696.0M
Quarterly, 8 quarters to 30 June 2026 · latest quarter's figure shown
Total return, dividends reinvested
1W
−1.4%
1M
+23.6%
YTD
−5.4%
1Y
+6.1%
From 52W high
−29.8%
From 52W low
+64.2%
$65
$152
52-week range, adjusted closes · the dot is the last close
Ticker Nerd rank

HOOD stock analysis: one number for the whole business

Consensus tells you what everyone already believes. The model scores Robinhood Markets, Inc. on its factor families — the same systematic rank behind the Ticker Nerd portfolio.

Where the model ranks itAs at 1 Sept 2026
54 / 100

Percentile across ~4,600 US stocks on Ticker Nerd’s systematic factor model. Higher is better. How the model is built and tested

Quality
97
Revisions
86
Volatility
67
Value
64
Growth
60
Momentum
55
Issuance
27
Accruals
11
Size
3

Quality (97): The business earns solid, repeatable profits on what it owns.

Accruals (11): A large share of reported profit has not shown up as cash, or the balance sheet is expanding quickly — both tend to unwind.

Size (3): Larger than most of the companies we track — more scrutinised, less often mispriced.

Built and run by Aslam Ghouse, an ex-Goldman Sachs quant trader with fourteen years in markets.

Wall Street

HOOD stock forecast 2026-2027: analyst price targets & predictions

The bullish and bearish analyst opinions on HOOD, reported as data — targets and ratings, the market's view beside the model's.

Share price and the analyst range, 12 monthsAdjusted close, US dollars
$60$80$100$120$140$160Oct 25Jan 26Apr 26Jul 26HOODHigh $164Median $124Low $57

Price targets and ratings are third-party analyst estimates, reported here as data. They are not Ticker Nerd forecasts, and they are frequently wrong.

Data provided by Twelve Data

What Wall Street says28 analysts
22 Buy4 Hold2 Sell
Low $57Median $124High $164

The green dot is the last close — the median target sits +15.9% from it.

Recent analyst actionsNewest first

Of the 20 most recent actions, 6 moved their price target up and 4 moved it down.

DateFirmActionRatingTarget
3 Aug 2026Cantor FitzgeraldMaintainsOverweight$130$115
30 July 2026BarclaysMaintainsOverweight$122$105
30 July 2026BTIGReiteratesBuy$125
30 July 2026CitizensReiteratesMarket Outperform$155
30 July 2026Goldman SachsMaintainsBuy$137$118
30 July 2026NeedhamMaintainsBuy$123$120
22 July 2026KeybancMaintainsOverweight$100$125
22 July 2026KeybancMaintainsOverweight
21 July 2026NeedhamMaintainsBuy$97$123
21 July 2026NeedhamMaintainsBuy
20 July 2026BernsteinMaintainsOutperform$130$160
20 July 2026BernsteinMaintainsOutperform
16 July 2026Goldman SachsMaintainsBuy$121$137
16 July 2026Goldman SachsMaintainsBuy
10 July 2026Morgan StanleyMaintainsEqual-Weight$95$124
10 July 2026Morgan StanleyMaintainsEqual-Weight
9 July 2026BarclaysMaintainsOverweight$82$122
9 July 2026BarclaysMaintainsOverweight
2 July 2026BTIGReiteratesBuy
2 July 2026MizuhoMaintainsOutperform

Price targets and ratings are third-party analyst estimates, reported here as data. They are not Ticker Nerd forecasts, and they are frequently wrong.

Market Radar

This page is one stock. Monday covers all of them.

Computed off the Friday close and sent before the US open.

Market Radar reports the week’s largest rank changes across roughly 4,600 US stocks, the factor behind each one, and where the market went. HOOD appears on the weeks it earns a place.

Free, every Monday. Unsubscribe any time.

Performance

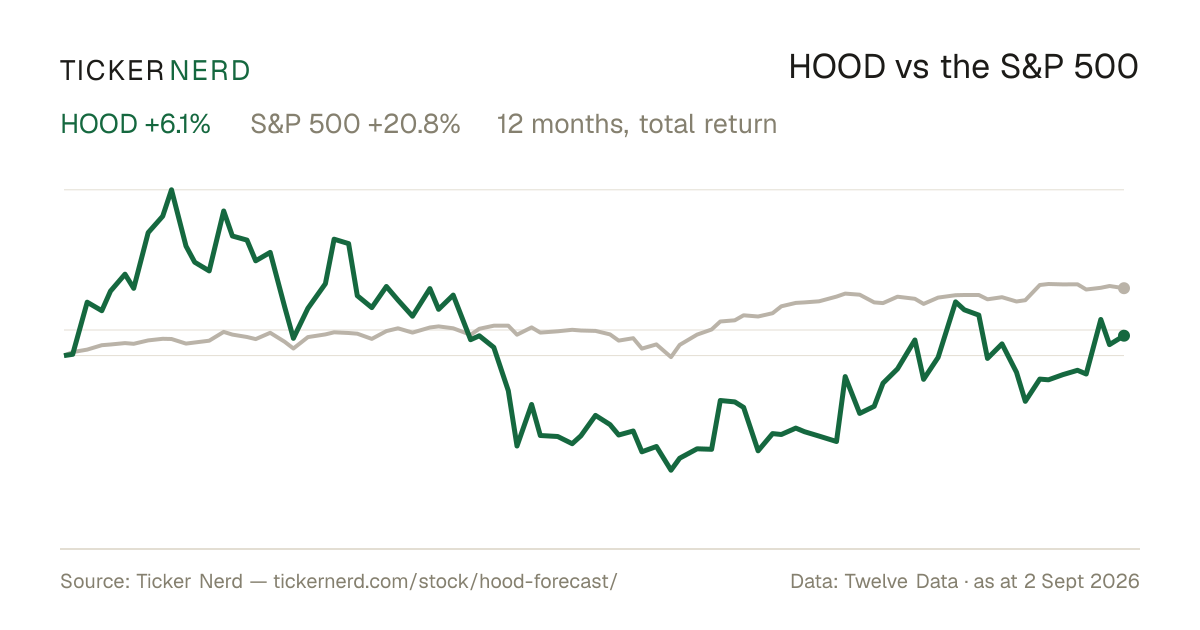
HOOD vs the S&P 500

Both lines are total return — dividends reinvested — so the comparison is honest on both sides.

Over the twelve months to 2 Sept 2026, Robinhood Markets, Inc. returned +6.1% against +20.8% for the S&P 500, dividends included.

HOOD vs S&P 500, last 12 monthsTotal return, rebased to 100
6080100120140Oct 25Jan 26Apr 26Jul 26HOODS&P 500

Download this chart as an image — free to reuse; link this page as the source.

Data provided by Twelve Data

Estimates

HOOD analyst estimate revisions

Not the forecast itself — the direction analysts are revising it. Revision direction is one of the model's factor families.

Which way the estimates are movingNext fiscal year
EPS revision, 90 days
+10.2%
Analysts raising
17
Analysts cutting
1
Fundamentals

Robinhood Markets, Inc. (HOOD) financial data

A margin means little on its own. Each bar marks where the figure sits across the whole US universe we score.

Valuation
Trailing P/E
45.8×

Cheaper than 16% of US stocks

Price / sales
18.9×

Cheaper than 10% of US stocks

Price / book
9.8×

Cheaper than 11% of US stocks

EV / EBITDA
42.3×

Cheaper than 6% of US stocks

Growth & margins
Revenue growth (YoY)
32.3%

Higher than 79% of US stocks

Earnings growth (YoY)
45.3%

Higher than 73% of US stocks

Gross margin
82.0%

Higher than 92% of US stocks

Operating margin
43.9%

Higher than 94% of US stocks

Net margin
42.0%

Higher than 95% of US stocks

Returns & dividend
Return on equity
23.6%

Higher than 84% of US stocks

Return on assets
4.5%

Higher than 74% of US stocks

Dividend yield

Bars mark the percentile across the ~4,600 US stocks Ticker Nerd covers, among those reporting the figure.

Key statistics

Robinhood Markets, Inc. (HOOD) statistics: revenue, profit & scale

The headline figures, each with its date. Every row carries its own link — cite it straight from here.

  • Robinhood Markets, Inc. has a market value of $93.1B and an enterprise value of $92.1B.

  • Revenue in the twelve months to 30 June 2026: $4.9B. The latest quarter grew 32.3% year on year.

  • Net income over the same four quarters: $2.1B, a 42.2% net margin.

  • Diluted earnings per share, trailing twelve months: $2.27.

  • Free cash flow in the twelve months to 30 June 2026: $178.0M, after $41.0M of capital spending.

  • Robinhood Markets, Inc. spent $871.0M on share buybacks in the twelve months to 30 June 2026.

  • Shares outstanding: 899.0M.

  • Trailing P/E: 45.8×; forward P/E: 31.6× — the forward figure prices analyst consensus estimates, not reported earnings.

  • Robinhood Markets, Inc. employs 2,900 people $1.7M of revenue per employee.

Statement figures: company filings via Twelve Data, four quarters to 30 June 2026 · market figures as at 2 Sept 2026

Data provided by Twelve Data

Peers

HOOD vs competitors

The nearest names by industry and size, scored by the same model — like for like.

Its peer group, ranked by the same modelCapital Markets
CompanyMarket capTKN rank
HOODRobinhood Markets, Inc.$93.1B
54
SCHWThe Charles Schwab Corp.$196.6B
92
IBKRInteractive Brokers Group, Inc.$40.3B
64
GSThe Goldman Sachs Group, Inc.$300.7B
86
LPLALPL Financial Holdings, Inc.$28.7B
67
MSMorgan Stanley$336.9B
88
TWTradeweb Markets, Inc.$25.2B
68

Look up any of the roughly 4,600 stocks we score.

The rank is the raw material. Whether the rules would actually own Robinhood Markets, Inc. — and when they’d sell — is the membership. See the Ticker Nerd 20 →

News

Latest HOOD news & analysis

Robinhood Markets, Inc. to Present at the Goldman Sachs Communacopia + Technology Conference on September 9, 2026

GlobeNewsWire · 2 Sept 2026neutral

Robinhood Markets, Inc. announced it will participate in the Goldman Sachs Communacopia + Technology Conference on Wednesday, September 9, 2026. The announcement was made via a press release from its Menlo Park, California headquarters.

Why it matters — HOOD watchers may look to this conference appearance for company presentations or commentary, giving them another opportunity to hear directly from Robinhood management.

Nvidia Is Still Retail Investors' Most-Held Stock on Robinhood, but a New Trillion-Dollar Stock Has Entered the Top 10

The Motley Fool · 2 Sept 2026positive

Robinhood data shows retail investors are increasingly gravitating toward artificial intelligence stocks, with Nvidia remaining the most-held stock on the platform and a new trillion-dollar company entering its top 10 holdings. This highlights the growing retail investor activity on Robinhood's platform.

Why it matters — The continued and growing retail engagement on Robinhood, particularly around popular AI stocks, signals healthy platform usage that could benefit Robinhood's trading activity and user metrics.

SoFi Drops 4%, Affirm Falls 5% as Yields Hit Balance-Sheet Lenders, Robinhood Holds Steady

24/7 Wall Street · 1 Sept 2026neutral

Rising yields hit balance-sheet lenders SoFi and Affirm, which dropped 4% and 5% respectively, while Robinhood held steady. The fintech selloff was targeted specifically at the two companies that carry consumer credit on their own balance sheets.

Why it matters — The divergence shows Robinhood being viewed differently from lenders exposed to rising yields, which could inform how HOOD watchers assess its positioning relative to fintech peers.

Robinhood's Tokenization Push: Can Chain and Stock Tokens Fuel Growth?

Zacks Investment Research · 1 Sept 2026positive

Robinhood's tokenization push is gaining traction, with Chain volume, Stock Tokens, and Earn broadening its digital-asset ecosystem beyond core trading. The company is expanding its offerings within the digital assets space.

Why it matters — A HOOD watcher would care because the company is diversifying its digital-asset ecosystem, which could broaden its revenue streams beyond traditional trading activity.

Robinhood: Shares Catch A Sell-Side Boost, Don't Go All In Yet

Seeking Alpha · 1 Sept 2026neutral

Robinhood Markets is rated Hold by Seeking Alpha, with Fair valuation and consolidating technicals despite a recent Morgan Stanley upgrade and bullish sell-side sentiment. The assessment follows strong Q2 results, including GAAP EPS of $0.62 that beat consensus, 33% YoY revenue growth, 28.4 million funded customers, $369B in platform assets (up 32% YoY), 4.8M Gold subscribers, and 13 businesses exceeding $100M in run-rate revenue.

Why it matters — The article provides a neutral counterpoint to bullish sell-side sentiment, giving HOOD watchers a balanced valuation and technical perspective alongside the company's strong operational results.

FAQ

Frequently asked questions about HOOD stock

What is the HOOD stock price forecast for 2026-2027?

The 28 Wall Street analysts covering Robinhood Markets, Inc. have a median 12-month price target of $124, with estimates ranging from $57 to $164. These are third-party analyst estimates, not Ticker Nerd forecasts, and they are frequently wrong.

Is HOOD stock a buy right now?

Of the 28 analysts covering Robinhood Markets, Inc., 22 rate it a Buy, 4 a Hold and 2 a Sell. Ticker Nerd's systematic factor model ranks Robinhood Markets, Inc. 54 out of 100 across roughly 4,600 US stocks as at 1 Sept 2026. None of this is personal advice — it does not consider your circumstances.

How does Ticker Nerd's model rank HOOD?

As at 1 Sept 2026, Robinhood Markets, Inc. ranks 54 out of 100 on Ticker Nerd's systematic factor model — a percentile across roughly 4,600 US stocks, built from its factor families. Its strongest factor family is Quality (97 of 100).

Will HOOD stock go up?

No one can know that. What the data says: the median 12-month target from 28 analysts implies +15.9% from the last close, and Ticker Nerd's factor model ranks Robinhood Markets, Inc. 54 out of 100 as at 1 Sept 2026. Analyst targets are third-party estimates and frequently wrong; none of this is personal advice.

What is the HOOD stock forecast for 2030?

No analyst covering Robinhood Markets, Inc. publishes a 2030 price target — Wall Street targets run 12 to 18 months out. Sites quoting a 2030 price for HOOD are extrapolating price history, which says nothing about the business. The furthest attributed numbers are the current analyst targets: $57 to $164 over the next 12 months.

How has HOOD stock performed over the past year?

Robinhood Markets, Inc. returned +6.1% over the 12 months to 2 Sept 2026, with dividends reinvested. Past performance does not indicate future returns.

What does Robinhood Markets, Inc. do?

Robinhood Markets Inc. Class A Common Stock represents the publicly traded equity of Robinhood Markets, a Menlo Park, California-based financial services company.

What is the latest news on HOOD?

The most recent item we track (GlobeNewsWire, 2 Sept 2026): "Robinhood Markets, Inc. to Present at the Goldman Sachs Communacopia + Technology Conference on September 9, 2026". Robinhood Markets, Inc. announced it will participate in the Goldman Sachs Communacopia + Technology Conference on Wednesday, September 9, 2026. The announcement was made via a press release from its Menlo Park, California headquarters.

Company

About Robinhood Markets, Inc.

Robinhood Markets Inc. Class A Common Stock represents the publicly traded equity of Robinhood Markets, a Menlo Park, California-based financial services company. Robinhood provides a mobile-first platform that allows retail customers to trade U.S. stocks, exchange-traded funds, options, cryptocurrencies, and related investment products. The company also offers cash management features, retirement accounts, margin investing, recurring investments, fractional shares, and other brokerage services designed for self-directed investors. In addition, Robinhood has expanded into advisory services, digital banking, private markets access, and event contracts, positioning it as a broad consumer finance platform rather than a traditional brokerage alone. Its business serves individual investors seeking convenient, app-based access to financial markets and account services. As Class A Common Stock, the asset reflects ownership in a company centered on digital brokerage, trading infrastructure, and modern retail investing services.

CEO Mr. Vladimir Tenev · 2,900 employees · United States · https://robinhood.com