INSMINSMHealthcare · Biotechnology

INSM Stock Forecast: Insmed, Inc. Price Predictions for 2026-2027

Last close, 25 Aug 2026
$124
−0.07% on the day

The 23 Wall Street analysts covering Insmed, Inc. hold a median 12-month price target of $198 — +59.4% from the last close. Ticker Nerd's systematic factor model, run across ~4,600 US stocks, ranks it 86 of 100 as at 24 Aug 2026 — inside the top quartile. Here, the model and the Street point the same way.

Market cap
$27.5B
Ticker Nerd rank
86 / 100
Median analyst target
$198
Analysts covering
23
Revenue$425.5M+296.1% y/y
Operating income−$101.3M
Net income−$13.2M
Free cash flow−$95.1M
Quarterly, 8 quarters to 30 June 2026 · latest quarter's figure shown
Total return, dividends reinvested
1W
−3.6%
1M
+15.9%
YTD
−28.8%
1Y
−3.5%
From 52W high
−41.4%
From 52W low
+34.8%
$92
$211
52-week range, adjusted closes · the dot is the last close
Ticker Nerd rank

INSM stock analysis: one number for the whole business

Consensus tells you what everyone already believes. The model scores Insmed, Inc. on its factor families — the same systematic rank behind the Ticker Nerd portfolio.

Where the model ranks itAs at 24 Aug 2026
86 / 100

Percentile across ~4,600 US stocks on Ticker Nerd’s systematic factor model. Higher is better. How the model is built and tested

Value
94
Revisions
90
Growth
90
Quality
86
Volatility
86
Accruals
53
Momentum
48
Issuance
33
Size
8

Value (94): The shares cost little relative to the profits and assets behind them — which can mean the market is too gloomy, or that the business really is in trouble.

Issuance (33): The company has been issuing shares or taking on financing, diluting existing holders.

Size (8): Larger than most of the companies we track — more scrutinised, less often mispriced.

Built and run by Aslam Ghouse, an ex-Goldman Sachs quant trader with fourteen years in markets.

Wall Street

INSM stock forecast 2026-2027: analyst price targets & predictions

The bullish and bearish analyst opinions on INSM, reported as data — targets and ratings, the market's view beside the model's.

Share price and the analyst range, 12 monthsAdjusted close, US dollars
$100$150$200$250Oct 25Jan 26Apr 26Jul 26INSMHigh $243Median $198Low $169

Price targets and ratings are third-party analyst estimates, reported here as data. They are not Ticker Nerd forecasts, and they are frequently wrong.

Data provided by Twelve Data

What Wall Street says23 analysts
23 Buy0 Hold0 Sell
Low $169Median $198High $243

The green dot is the last close — the median target sits +59.4% from it.

Recent analyst actionsNewest first

Of the 20 most recent actions, 4 moved their price target up and 2 moved it down.

DateFirmActionRatingTarget
10 Aug 2026JP MorganMaintainsOverweight$179$175
10 Aug 2026Truist SecuritiesReiteratesBuy$185$195
7 Aug 2026Evercore ISI GroupMaintainsOutperform$160$170
7 Aug 2026GuggenheimMaintainsBuy$207$205
7 Aug 2026Wells FargoMaintainsOverweight$161$169
21 July 2026BMO CapitalInitiatesOutperform$192
21 July 2026BMO CapitalInitiatesOutperform
15 July 2026Wells FargoMaintainsOverweight$160$161
15 July 2026Wells FargoMaintainsOverweight
10 July 2026GuggenheimReiteratesBuy
10 July 2026GuggenheimReiteratesBuy$207
22 June 2026Evercore ISI GroupMaintainsOutperform
8 June 2026JP MorganMaintainsOverweight
5 June 2026RBC CapitalMaintainsOutperform
14 May 2026Truist SecuritiesMaintainsBuy
8 May 2026GuggenheimMaintainsBuy
8 May 2026RBC CapitalMaintainsOutperform
8 May 2026Wells FargoMaintainsOverweight
17 Apr 2026Roth CapitalReiteratesBuy
14 Apr 2026RBC CapitalMaintainsOutperform

Price targets and ratings are third-party analyst estimates, reported here as data. They are not Ticker Nerd forecasts, and they are frequently wrong.

Market Radar

This page is one stock. Monday covers all of them.

Computed off the Friday close and sent before the US open.

Market Radar reports the week’s largest rank changes across roughly 4,600 US stocks, the factor behind each one, and where the market went. INSM appears on the weeks it earns a place.

Free, every Monday. Unsubscribe any time.

Performance

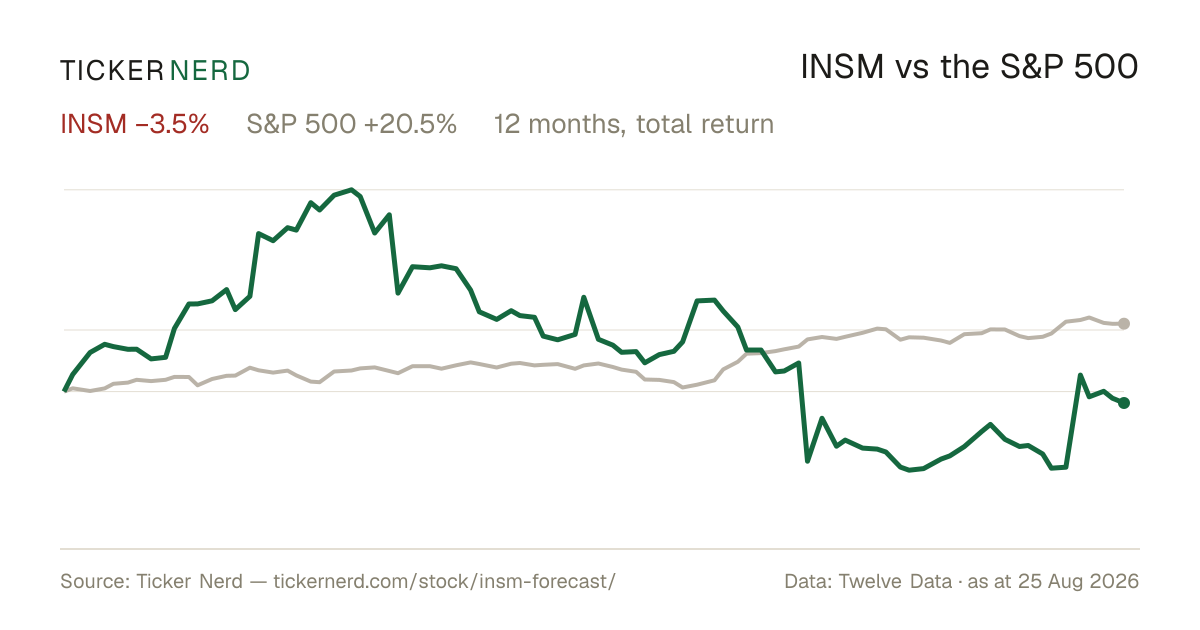
INSM vs the S&P 500

Both lines are total return — dividends reinvested — so the comparison is honest on both sides.

Over the twelve months to 25 Aug 2026, Insmed, Inc. returned −3.5% against +20.5% for the S&P 500, dividends included.

INSM vs S&P 500, last 12 monthsTotal return, rebased to 100
6080100120140160Oct 25Jan 26Apr 26Jul 26INSMS&P 500

Download this chart as an image — free to reuse; link this page as the source.

Data provided by Twelve Data

Estimates

INSM analyst estimate revisions

Not the forecast itself — the direction analysts are revising it. Revision direction is one of the model's factor families.

Which way the estimates are movingNext fiscal year
Analysts raising
8
Analysts cutting
0
Fundamentals

Insmed, Inc. (INSM) financial data

A margin means little on its own. Each bar marks where the figure sits across the whole US universe we score.

Valuation
Trailing P/E
−19.6×

Cheaper than 96% of US stocks

Price / sales
24.1×

Cheaper than 8% of US stocks

Price / book
36.2×

Cheaper than 3% of US stocks

EV / EBITDA
−34.0×

Cheaper than 92% of US stocks

Growth & margins
Revenue growth (YoY)
296.1%

Higher than 97% of US stocks

Earnings growth (YoY)
296.1%

Higher than 93% of US stocks

Gross margin
84.2%

Higher than 93% of US stocks

Operating margin
−23.8%

Higher than 21% of US stocks

Net margin
−76.9%

Higher than 7% of US stocks

Returns & dividend
Return on equity
−87.2%

Higher than 15% of US stocks

Return on assets
−22.2%

Higher than 18% of US stocks

Dividend yield

Bars mark the percentile across the ~4,600 US stocks Ticker Nerd covers, among those reporting the figure.

Key statistics

Insmed, Inc. (INSM) statistics: revenue, profit & scale

The headline figures, each with its date. Every row carries its own link — cite it straight from here.

  • Insmed, Inc. has a market value of $27.5B and an enterprise value of $27.0B.

  • Revenue in the twelve months to 30 June 2026: $1.1B. The latest quarter grew 296.1% year on year.

  • Net income over the same four quarters: −$875.3M, a −76.9% net margin.

  • Diluted earnings per share, trailing twelve months: $−4.11.

  • Free cash flow in the twelve months to 30 June 2026: −$807.7M.

  • Shares outstanding: 218.3M.

  • Trailing P/E: −19.6×; forward P/E: 174.7× — the forward figure prices analyst consensus estimates, not reported earnings.

  • Insmed, Inc. employs 1,664 people $684K of revenue per employee.

Statement figures: company filings via Twelve Data, four quarters to 30 June 2026 · market figures as at 24 Aug 2026

Data provided by Twelve Data

Peers

INSM vs competitors

The nearest names by industry and size, scored by the same model — like for like.

Its peer group, ranked by the same modelBiotechnology
CompanyMarket capTKN rank
INSMInsmed, Inc.$27.5B
86
ROIVRoivant Sciences Ltd.$26.0B
36
INCYIncyte Corp.$25.6B
91
ALNYAlnylam Pharmaceuticals, Inc.$31.2B
56
RPRXRoyalty Pharma plc$35.3B
86
RVMDRevolution Medicines, Inc.$44.2B
36
JAZZJazz Pharmaceuticals Plc$16.0B
100

Look up any of the roughly 4,600 stocks we score.

The rank is the raw material. Whether the rules would actually own Insmed, Inc. — and when they’d sell — is the membership. See the Ticker Nerd 20 →

News

Latest INSM news & analysis

Alger Mid Cap 40 ETF Q2 2026 Portfolio Review

Seeking Alpha · 25 Aug 2026negative

The Alger Mid Cap 40 ETF outperformed the Russell Midcap Growth Index in Q2 2026, with Astera Labs, Nebius Group, and Western Digital among top contributors. Insmed Incorporated was listed among the top detractors from the fund's performance during the quarter.

Why it matters — Insmed being cited as one of the top detractors indicates the stock underperformed within a major growth fund during the second quarter.

BRINSUPRI® (brensocatib) Approved by Japan's Ministry of Health, Labour and Welfare for the Treatment of Patients With Non-Cystic Fibrosis Bronchiectasis, a Serious, Chronic Lung Disease

PRNewsWire · 24 Aug 2026positive

Insmed announced that Japan's Ministry of Health, Labour and Welfare has approved BRINSUPRI (brensocatib 25-mg tablet), an oral once-daily therapy for non-cystic fibrosis bronchiectasis in adults and pediatric patients aged 12 and older. The approval marks the first-in-disease and first-in-class therapy for NCFB in Japan.

Why it matters — This regulatory approval brings Insmed's first-in-class NCFB therapy to a new, major market, expanding its commercial footprint for the drug.

Invesco Discovery Mid Cap Growth Fund Q2 2026 Portfolio Performance

Seeking Alpha · 23 Aug 2026neutral

Invesco Discovery Mid Cap Growth Fund posted a positive return and outperformed its benchmark in Q2, aided by strong stock selection and an overweight in IT. The fund was underweight in communication services, health care, and consumer discretionary, while energy weakness partially offset gains.

Why it matters — Insmed, a health care sector holding, was part of a sector the fund was underweight in, so its weighting and performance could affect INSM's representation in the fund.

Biotech Is Booming, But These 2 Stocks Missed the Memo

Benzinga · 20 Aug 2026negative

Biotech stocks are enjoying one of their best stretches in years, with the iShares Biotechnology ETF jumping nearly 5% and reaching new all-time highs. However, the headline notes that two stocks behind this piece missed the rally.

Why it matters — This matters to Insmed watchers because it may flag that Insmed did not participate in the broader sector's recent gains.

Alger Small Cap Growth Fund Q2 2026 Portfolio Review

Seeking Alpha · 14 Aug 2026negative

In its Q2 2026 portfolio review, the Alger Small Cap Growth Fund reported that Insmed Incorporated was among the top detractors from the fund's performance during the quarter, while other holdings such as Nebius Group, Astera Labs, and Twist Bioscience were top contributors.

Why it matters — The disclosure signals that Insmed's stock performance during Q2 2026 negatively weighed on a major small-cap growth fund's results, offering insight into how institutional holders viewed Insmed in the period.

FAQ

Frequently asked questions about INSM stock

What is the INSM stock price forecast for 2026-2027?

The 23 Wall Street analysts covering Insmed, Inc. have a median 12-month price target of $198, with estimates ranging from $169 to $243. These are third-party analyst estimates, not Ticker Nerd forecasts, and they are frequently wrong.

Is INSM stock a buy right now?

Of the 23 analysts covering Insmed, Inc., 23 rate it a Buy, 0 a Hold and 0 a Sell. Ticker Nerd's systematic factor model ranks Insmed, Inc. 86 out of 100 across roughly 4,600 US stocks as at 24 Aug 2026. None of this is personal advice — it does not consider your circumstances.

How does Ticker Nerd's model rank INSM?

As at 24 Aug 2026, Insmed, Inc. ranks 86 out of 100 on Ticker Nerd's systematic factor model — a percentile across roughly 4,600 US stocks, built from its factor families. Its strongest factor family is Value (94 of 100).

Will INSM stock go up?

No one can know that. What the data says: the median 12-month target from 23 analysts implies +59.4% from the last close, and Ticker Nerd's factor model ranks Insmed, Inc. 86 out of 100 as at 24 Aug 2026. Analyst targets are third-party estimates and frequently wrong; none of this is personal advice.

What is the INSM stock forecast for 2030?

No analyst covering Insmed, Inc. publishes a 2030 price target — Wall Street targets run 12 to 18 months out. Sites quoting a 2030 price for INSM are extrapolating price history, which says nothing about the business. The furthest attributed numbers are the current analyst targets: $169 to $243 over the next 12 months.

How has INSM stock performed over the past year?

Insmed, Inc. returned -3.5% over the 12 months to 25 Aug 2026, with dividends reinvested. Past performance does not indicate future returns.

What does Insmed, Inc. do?

Insmed Inc. is a global biopharmaceutical company focused on developing and commercializing therapies for patients with serious and rare diseases.

What is the latest news on INSM?

The most recent item we track (Seeking Alpha, 25 Aug 2026): "Alger Mid Cap 40 ETF Q2 2026 Portfolio Review". The Alger Mid Cap 40 ETF outperformed the Russell Midcap Growth Index in Q2 2026, with Astera Labs, Nebius Group, and Western Digital among top contributors. Insmed Incorporated was listed among the top detractors from the fund's performance during the quarter.

Company

About Insmed, Inc.

Insmed Inc. is a global biopharmaceutical company focused on developing and commercializing therapies for patients with serious and rare diseases. The company concentrates its activities across three key therapeutic areas: respiratory, immunology and inflammation, and neuro and other rare conditions. Insmed’s commercial portfolio is anchored by Arikayce and Brinsupri, both targeting respiratory disorders and serving patients with limited existing treatment options. Beyond its marketed products, the company maintains a diversified clinical pipeline that includes programs such as TPIP, INS1148, brensocatib, and INS1201, which address a range of complex inflammatory and rare disease pathways. Insmed also invests in pre-clinical research using advanced technologies, including gene therapy, AI-driven protein engineering, RNA end-joining, synthetic rescue approaches, and modern protein manufacturing platforms. Headquartered in Bridgewater, New Jersey, and founded in 1988, Insmed plays a specialized role in the healthcare sector by addressing high-need patient populations and supplying therapies primarily to the United States and other key global markets.

CEO Mr. William H. Lewis J.D., M.B.A. · 1,664 employees · United States · https://www.insmed.com