IRDIRDHealthcare · Biotechnology

IRD Stock Forecast: Opus Genetics, Inc. Price Predictions for 2026-2027

Last close, 24 Aug 2026
$4.03
−0.49% on the day

The 19 Wall Street analysts covering Opus Genetics, Inc. hold a median 12-month price target of $10 — +148.1% from the last close. Ticker Nerd's systematic factor model, run across ~4,600 US stocks, ranks it 55 of 100 as at 22 Aug 2026 — in the upper half.

Market cap
$336.9M
Ticker Nerd rank
55 / 100
Median analyst target
$10
Analysts covering
19
Revenue$755K−73.8% y/y
Operating income−$16.5M
Net income−$8.1M
Free cash flow−$11.9M
Quarterly, 8 quarters to 30 June 2026 · latest quarter's figure shown
Total return, dividends reinvested
1W
+10.4%
1M
+30.8%
YTD
+100.5%
1Y
+250.4%
From 52W high
−29.9%
From 52W low
+250.4%
$1.15
$5.75
52-week range, adjusted closes · the dot is the last close
Ticker Nerd rank

IRD stock analysis: one number for the whole business

Consensus tells you what everyone already believes. The model scores Opus Genetics, Inc. on its factor families — the same systematic rank behind the Ticker Nerd portfolio.

Where the model ranks itAs at 22 Aug 2026
55 / 100

Percentile across ~4,600 US stocks on Ticker Nerd’s systematic factor model. Higher is better. How the model is built and tested

Momentum
90
Volatility
81
Growth
67
Accruals
66
Size
60
Revisions
54
Value
50
Quality
24
Issuance
5

Momentum (90): The shares have been drifting up relative to others.

Issuance (5): The company has been issuing shares or taking on financing, diluting existing holders.

Built and run by Aslam Ghouse, an ex-Goldman Sachs quant trader with fourteen years in markets.

Wall Street

IRD stock forecast 2026-2027: analyst price targets & predictions

The bullish and bearish analyst opinions on IRD, reported as data — targets and ratings, the market's view beside the model's.

Share price and the analyst range, 12 monthsAdjusted close, US dollars
$0.00$5.00$10.00$15.00Oct 25Jan 26Apr 26Jul 26IRDHigh $16Median $10Low $8

Price targets and ratings are third-party analyst estimates, reported here as data. They are not Ticker Nerd forecasts, and they are frequently wrong.

Data provided by Twelve Data

What Wall Street says19 analysts
19 Buy0 Hold0 Sell
Low $8Median $10High $16

The green dot is the last close — the median target sits +148.1% from it.

Recent analyst actionsNewest first
DateFirmActionRatingTarget
7 Aug 2026RBC CapitalMaintainsOutperform$10$9.00
29 July 2026TD CowenInitiatesBuy
6 July 2026BTIGReiteratesBuy
6 July 2026BTIGReiteratesBuy$12
6 July 2026Chardan CapitalMaintainsBuy
6 July 2026Chardan CapitalMaintainsBuy$13
18 June 2026Chardan CapitalMaintainsBuy
17 June 2026HC Wainwright & Co.ReiteratesBuy
16 June 2026BTIGReiteratesBuy
15 June 2026CitizensReiteratesMarket Outperform
4 June 2026GuggenheimInitiatesBuy
21 May 2026Leerink PartnersInitiatesOutperform
13 May 2026CitizensMaintainsMarket Outperform
28 Apr 2026CitizensInitiatesMarket Outperform
30 Mar 2026Cantor FitzgeraldInitiatesOverweight
16 Mar 2026OppenheimerInitiatesOutperform
12 Mar 2026Chardan CapitalMaintainsBuy
12 Mar 2026WedbushMaintainsOutperform
2 Mar 2026BTIGMaintainsBuy

Price targets and ratings are third-party analyst estimates, reported here as data. They are not Ticker Nerd forecasts, and they are frequently wrong.

Market Radar

This page is one stock. Monday covers all of them.

Computed off the Friday close and sent before the US open.

Market Radar reports the week’s largest rank changes across roughly 4,600 US stocks, the factor behind each one, and where the market went. IRD appears on the weeks it earns a place.

Free, every Monday. Unsubscribe any time.

Performance

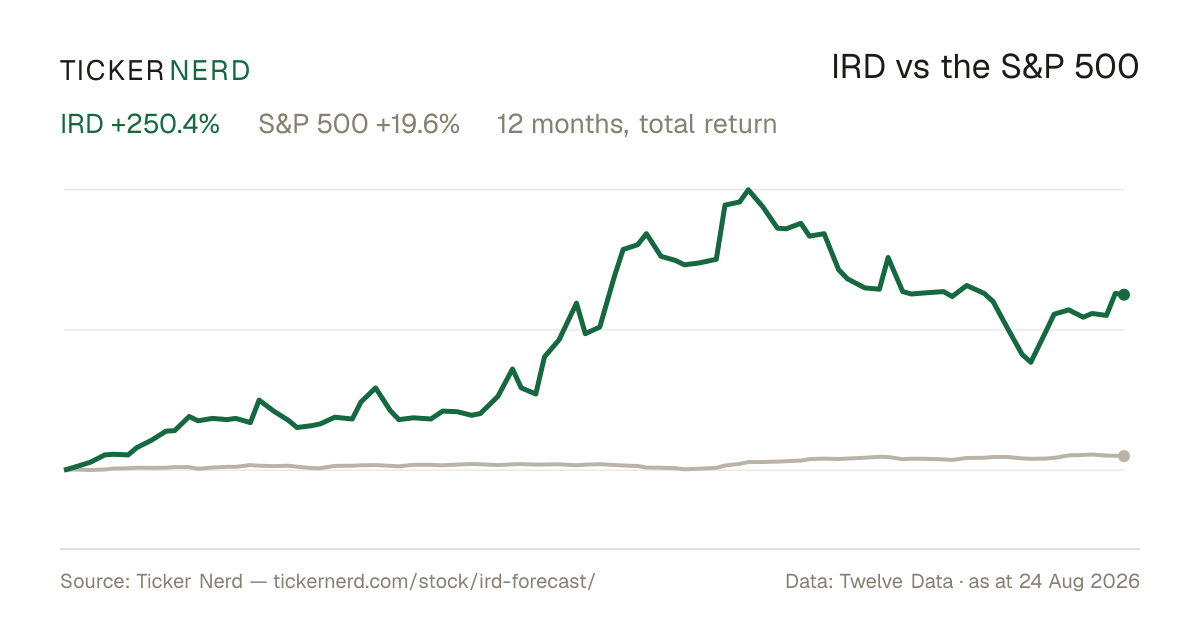
IRD vs the S&P 500

Both lines are total return — dividends reinvested — so the comparison is honest on both sides.

Over the twelve months to 24 Aug 2026, Opus Genetics, Inc. returned +250.4% against +19.6% for the S&P 500, dividends included.

IRD vs S&P 500, last 12 monthsTotal return, rebased to 100
100200300400500Oct 25Jan 26Apr 26Jul 26IRDS&P 500

Download this chart as an image — free to reuse; link this page as the source.

Data provided by Twelve Data

Estimates

IRD analyst estimate revisions

Not the forecast itself — the direction analysts are revising it. Revision direction is one of the model's factor families.

Which way the estimates are movingNext fiscal year
Analysts raising
3
Analysts cutting
1
Fundamentals

Opus Genetics, Inc. (IRD) financial data

A margin means little on its own. Each bar marks where the figure sits across the whole US universe we score.

Valuation
Trailing P/E
−5.1×

Cheaper than 90% of US stocks

Price / sales
34.2×

Cheaper than 7% of US stocks

Price / book
−29.7×

Cheaper than 99% of US stocks

EV / EBITDA
−5.6×

Cheaper than 79% of US stocks

Growth & margins
Revenue growth (YoY)
−73.8%

Higher than 3% of US stocks

Earnings growth (YoY)
−73.8%

Higher than 5% of US stocks

Gross margin
Operating margin
−2182.8%

Higher than 4% of US stocks

Net margin
0.0%

Higher than 30% of US stocks

Returns & dividend
Return on equity
−4796.5%

Higher than 1% of US stocks

Return on assets
−48.1%

Higher than 8% of US stocks

Dividend yield

Bars mark the percentile across the ~4,600 US stocks Ticker Nerd covers, among those reporting the figure.

Key statistics

Opus Genetics, Inc. (IRD) statistics: revenue, profit & scale

The headline figures, each with its date. Every row carries its own link — cite it straight from here.

  • Opus Genetics, Inc. has a market value of $336.9M and an enterprise value of $284.3M.

  • Revenue in the twelve months to 30 June 2026: $9.9M. The latest quarter shrank 73.8% year on year.

  • Net income over the same four quarters: −$107.6M, a −1091.8% net margin.

  • Free cash flow in the twelve months to 30 June 2026: −$40.7M.

  • Opus Genetics, Inc. spent $149K on share buybacks in the twelve months to 30 June 2026.

  • Shares outstanding: 82.6M.

  • Trailing P/E: −5.1×; forward P/E: −5.7× — the forward figure prices analyst consensus estimates, not reported earnings.

  • Opus Genetics, Inc. employs 27 people $365K of revenue per employee.

Statement figures: company filings via Twelve Data, four quarters to 30 June 2026 · market figures as at 25 Aug 2026

Data provided by Twelve Data

Peers

IRD vs competitors

The nearest names by industry and size, scored by the same model — like for like.

Its peer group, ranked by the same modelBiotechnology
CompanyMarket capTKN rank
IRDOpus Genetics, Inc.$336.9M
55
YDESYD Bio Ltd.$330.7M
46
IKTInhibikase Therapeutics, Inc.$333.5M
31
IMRXImmuneering Corp.$342.2M
46
SABSSAB Biotherapeutics, Inc.$343.9M
36
STROSutro Biopharma, Inc.$344.8M
75
OBIOOrchestra Biomed Holdings, Inc.$313.7M
36

Look up any of the roughly 4,600 stocks we score.

The rank is the raw material. Whether the rules would actually own Opus Genetics, Inc. — and when they’d sell — is the membership. See the Ticker Nerd 20 →

News

Latest IRD news & analysis

Opus Genetics Reports Inducement Grants Under Nasdaq Listing Rule 5635(c)(4)

GlobeNewsWire · 19 Aug 2026neutral

Opus Genetics announced that the Compensation Committee of its Board of Directors approved equity awards under the company's 2021 Inducement Plan as material inducements to employment for three non-executive employees who were not previously employees or directors of the company. The grants were made under Nasdaq Listing Rule 5635(c)(4).

Why it matters — For IRD watchers, the inducement grants signal the company's hiring of new talent to support its clinical-stage gene therapy programs for inherited retinal diseases.

Opus Genetics, Inc. (IRD) Reports Q2 Loss, Lags Revenue Estimates

Zacks Investment Research · 6 Aug 2026negative

Opus Genetics, Inc. (IRD) reported a quarterly loss of $0.14 per share, narrower than the Zacks Consensus Estimate of a $0.15 loss but wider than the $0.12 loss a year ago. The company's revenue lagged estimates for the quarter.

Why it matters — IRD watchers would care because the Q2 result beat analyst expectations on the bottom line, though the widening year-over-year loss and revenue shortfall point to ongoing pressure on the company's financials.

Opus Genetics Announces Financial Results for Second Quarter 2026 and Provides Corporate Update

GlobeNewsWire · 6 Aug 2026neutral

Opus Genetics, Inc. announced its financial results for the second quarter of 2026 and provided a corporate update. Based on the item provided, the announcement reports the company's quarterly financial performance and an update on its activities.

Why it matters — For watchers of this inherited retinal disease (IRD) company, the corporate update often accompanies the financial results with information about the progress of its programs.

Opus Genetics Completes Patient Enrollment in Registrational Phase 3 Trial of OPGx-LCA5 for LCA5-Associated Inherited Retinal Disease

GlobeNewsWire · 3 Aug 2026positive

Opus Genetics announced completion of patient enrollment in its registrational Phase 3 clinical trial of OPGx-LCA5, an investigational gene therapy for LCA5-associated inherited retinal disease. Topline six-month efficacy data are expected by the end of 2027, with a possible BLA submission based on six-month data and 12-month durability data provided during review.

Why it matters — A fully enrolled registrational Phase 3 trial for a gene therapy targeting LCA5-associated inherited retinal disease advances the path toward a potential regulatory submission for a currently unaddressed form of retinal disease.

FAQ

Frequently asked questions about IRD stock

What is the IRD stock price forecast for 2026-2027?

The 19 Wall Street analysts covering Opus Genetics, Inc. have a median 12-month price target of $10, with estimates ranging from $8 to $16. These are third-party analyst estimates, not Ticker Nerd forecasts, and they are frequently wrong.

Is IRD stock a buy right now?

Of the 19 analysts covering Opus Genetics, Inc., 19 rate it a Buy, 0 a Hold and 0 a Sell. Ticker Nerd's systematic factor model ranks Opus Genetics, Inc. 55 out of 100 across roughly 4,600 US stocks as at 22 Aug 2026. None of this is personal advice — it does not consider your circumstances.

How does Ticker Nerd's model rank IRD?

As at 22 Aug 2026, Opus Genetics, Inc. ranks 55 out of 100 on Ticker Nerd's systematic factor model — a percentile across roughly 4,600 US stocks, built from its factor families. Its strongest factor family is Momentum (90 of 100).

Will IRD stock go up?

No one can know that. What the data says: the median 12-month target from 19 analysts implies +148.1% from the last close, and Ticker Nerd's factor model ranks Opus Genetics, Inc. 55 out of 100 as at 22 Aug 2026. Analyst targets are third-party estimates and frequently wrong; none of this is personal advice.

What is the IRD stock forecast for 2030?

No analyst covering Opus Genetics, Inc. publishes a 2030 price target — Wall Street targets run 12 to 18 months out. Sites quoting a 2030 price for IRD are extrapolating price history, which says nothing about the business. The furthest attributed numbers are the current analyst targets: $8 to $16 over the next 12 months.

How has IRD stock performed over the past year?

Opus Genetics, Inc. returned +250.4% over the 12 months to 24 Aug 2026, with dividends reinvested. Past performance does not indicate future returns.

What does Opus Genetics, Inc. do?

Opus Genetics Inc. is an innovative biotechnology firm that focuses on the development of gene therapies for inherited retinal diseases.

What is the latest news on IRD?

The most recent item we track (GlobeNewsWire, 19 Aug 2026): "Opus Genetics Reports Inducement Grants Under Nasdaq Listing Rule 5635(c)(4)". Opus Genetics announced that the Compensation Committee of its Board of Directors approved equity awards under the company's 2021 Inducement Plan as material inducements to employment for three non-executive employees who were not previously employees or directors of the company. The grants were made under Nasdaq Listing Rule 5635(c)(4).

Company

About Opus Genetics, Inc.

Opus Genetics Inc. is an innovative biotechnology firm that focuses on the development of gene therapies for inherited retinal diseases. Operating within the burgeoning field of genetic medicine, the company's primary aim is to address sight-threatening conditions that currently have limited or no treatment options. By leveraging cutting-edge genetic research and technology, Opus Genetics Inc. seeks to pioneer treatments that can alter the progression of these diseases at a genetic level. Impacting the healthcare and biopharmaceutical sectors, the company plays a critical role in advancing therapeutic solutions for ocular diseases, positioning itself as a key player in the quest for vision-restoring interventions. With its innovative approach, Opus Genetics Inc. holds potential significance in the market by focusing on unmet clinical needs and contributing to the broader goal of precision medicine.

CEO Dr. George Magrath M.B.A., M.D., M.S. · 27 employees · United States · https://opusgtx.com