KG Stock Forecast: Kestrel Group Ltd. Price Predictions for 2026-2027
Ticker Nerd's systematic factor model, run across ~4,600 US stocks, ranks it 71 of 100 as at 1 Aug 2026 — in the upper half.
KG stock analysis: one number for the whole business
Consensus tells you what everyone already believes. The model scores Kestrel Group Ltd. on its factor families — the same systematic rank behind the Ticker Nerd portfolio.
Percentile across ~4,600 US stocks on Ticker Nerd’s systematic factor model. Higher is better. How the model is built and tested
Growth (99): Sales and profits are climbing, and climbing faster than before.
Momentum (1): The shares have been drifting down relative to others.
The rank is the raw material. Whether the rules would actually own Kestrel Group Ltd. — and when they’d sell — is the membership.
KG stock forecast 2026-2027: analyst price targets & predictions
The bullish and bearish analyst opinions on KG, reported as data — targets and ratings, the market's view beside the model's.
Price targets and ratings are third-party analyst estimates, reported here as data. They are not Ticker Nerd forecasts, and they are frequently wrong.
KG analyst estimate revisions
Not the forecast itself — the direction analysts are revising it. Revision direction is one of the model's factor families.
Kestrel Group Ltd. (KG) financial data
A margin means little on its own. Each bar marks where the figure sits across the whole US universe we score.
- Trailing P/E
- 1.6×
- Price / sales
- 1.6×
- Price / book
- 0.6×
- EV / EBITDA
- —
Cheaper than 70% of US stocks
Cheaper than 59% of US stocks
Cheaper than 83% of US stocks
- Revenue growth (YoY)
- 1112.0%
- Earnings growth (YoY)
- 373.6%
- Gross margin
- —
- Operating margin
- −44.9%
- Net margin
- 91.4%
Higher than 99% of US stocks
Higher than 95% of US stocks
Higher than 18% of US stocks
Higher than 99% of US stocks
- Return on equity
- 68.4%
- Return on assets
- −0.4%
- Dividend yield
- 2.3%
Higher than 94% of US stocks
Higher than 42% of US stocks
Higher than 50% of US dividend payers
Bars mark the percentile across the ~4,600 US stocks Ticker Nerd covers, among those reporting the figure.
KG vs competitors
The nearest names by industry and size, scored by the same model — like for like.
| Company | Market cap | TKN rank |
|---|---|---|
| KGKestrel Group Ltd. | $69.4M | 71 |
| OXBROxbridge Re Holdings Ltd. | $10.6M | 30 |
| GLREGreenlight Capital Re Ltd. | $567.8M | 75 |
| CLSTCatalyst Bancorp, Inc.* | $70.2M | 45 |
| DTCXDatacentrex, Inc.* | $68.4M | 3 |
| RIBBRibbon Acquisition Corp.* | $67.8M | 57 |
| HFBLHome Federal Bancorp, Inc. of Louisiana* | $71.4M | 68 |
* Nearest Financial Services names by size — few insurance - reinsurance companies of this scale trade in the US universe.
This page is one stock. Monday covers all of them.
Computed off the Friday close and sent before the US open.
Market Radar reports the week’s largest rank changes across roughly 4,600 US stocks, the factor behind each one, and where the market went. KG appears on the weeks it earns a place.
Frequently asked questions about KG stock
How does Ticker Nerd's model rank KG?
As at 1 Aug 2026, Kestrel Group Ltd. ranks 71 out of 100 on Ticker Nerd's systematic factor model — a percentile across roughly 4,600 US stocks, built from its factor families. Its strongest factor family is Growth (99 of 100).
What is the KG stock forecast for 2030?
No analyst covering Kestrel Group Ltd. publishes a 2030 price target — Wall Street targets run 12 to 18 months out. Sites quoting a 2030 price for KG are extrapolating price history, which says nothing about the business.
How has KG stock performed over the past year?
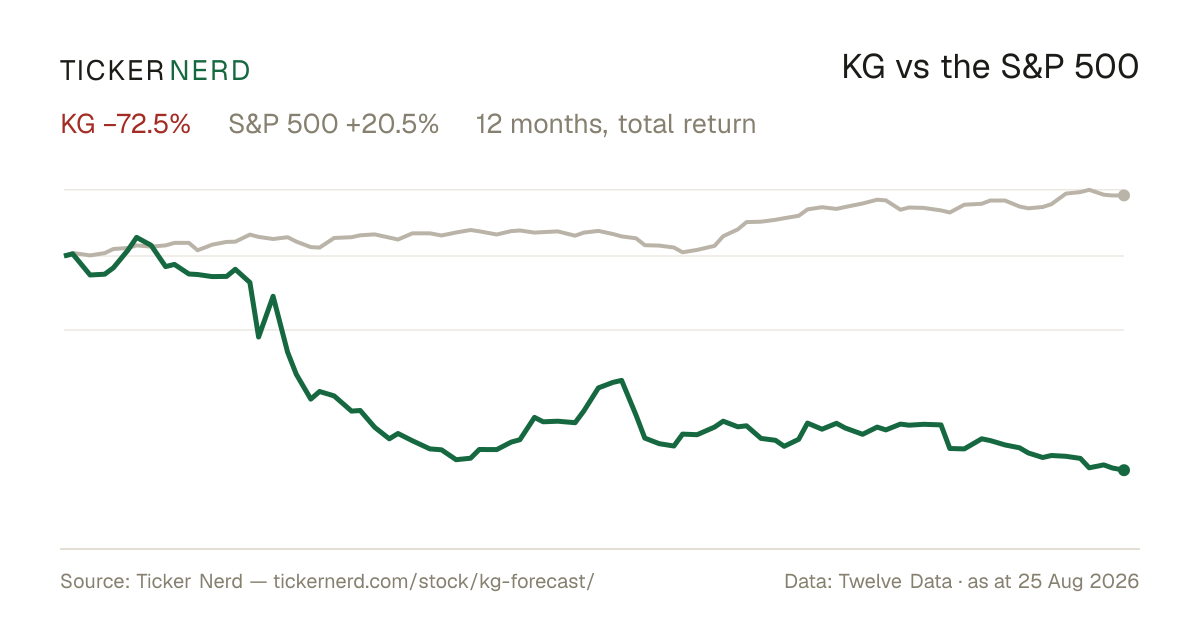
Kestrel Group Ltd. returned -68.4% over the 12 months to 3 Aug 2026, with dividends reinvested. Past performance does not indicate future returns.
What does Kestrel Group Ltd. do?
Kestrel Group, Inc. operates as a specialty insurance services provider focused on fronting services for insurance program managers, managing general agents (MGAs), reinsurers, and reinsurance brokers.
About Kestrel Group Ltd.
Kestrel Group, Inc. operates as a specialty insurance services provider focused on fronting services for insurance program managers, managing general agents (MGAs), reinsurers, and reinsurance brokers. The company plays a pivotal role in the insurance market by facilitating the placement and management of both admitted and surplus lines insurance programs across the United States, leveraging exclusive management contracts with four A.M. Best A- rated insurance carriers—subsidiaries of AmTrust Financial Group. Kestrel Group is structured as a capital-light, fee-based platform, generally avoiding significant underwriting risk while supporting a wide range of insurance business lines, including casualty, workers' compensation, and various property segments. Formed through the strategic merger of Kestrel Group and Maiden Holdings, the company emphasizes innovation, efficient client service, and long-term industry partnerships, positioning itself as a values-driven and scalable solution for program business growth in the insurance sector.
CEO Mr. Bradford Luke Ledbetter · 44 employees · Bermuda · https://www.kestrelgroup.com