LTGR Stock Forecast: Long Table Growth Corp. Price Predictions for 2026-2027
Ticker Nerd's systematic factor model, run across ~4,600 US stocks, ranks it 8 of 100 as at 14 Oct 2026 — in the weakest quartile.
LTGR stock analysis: one number for the whole business
Consensus tells you what everyone already believes. The model scores Long Table Growth Corp. on its factor families — the same systematic rank behind the Ticker Nerd portfolio.
Percentile across ~4,600 US stocks on Ticker Nerd’s systematic factor model. Higher is better. How the model is built and tested
Size (65): Smaller than most of the companies we track.
Accruals (8): A large share of reported profit has not shown up as cash, or the balance sheet is expanding quickly — both tend to unwind.
Built and run by Aslam Ghouse, an ex-Goldman Sachs quant trader with fourteen years in markets.
LTGR stock forecast 2026-2027: analyst price targets & predictions
The bullish and bearish analyst opinions on LTGR, reported as data — targets and ratings, the market's view beside the model's.
Price targets and ratings are third-party analyst estimates, reported here as data. They are not Ticker Nerd forecasts, and they are frequently wrong.
Data provided by Twelve Data
Price targets and ratings are third-party analyst estimates, reported here as data. They are not Ticker Nerd forecasts, and they are frequently wrong.
This page is one stock. Monday covers all of them.
Computed off the Friday close and sent before the US open.
Market Radar reports the week’s largest rank changes across roughly 4,600 US stocks, the factor behind each one, and where the market went. LTGR appears on the weeks it earns a place.
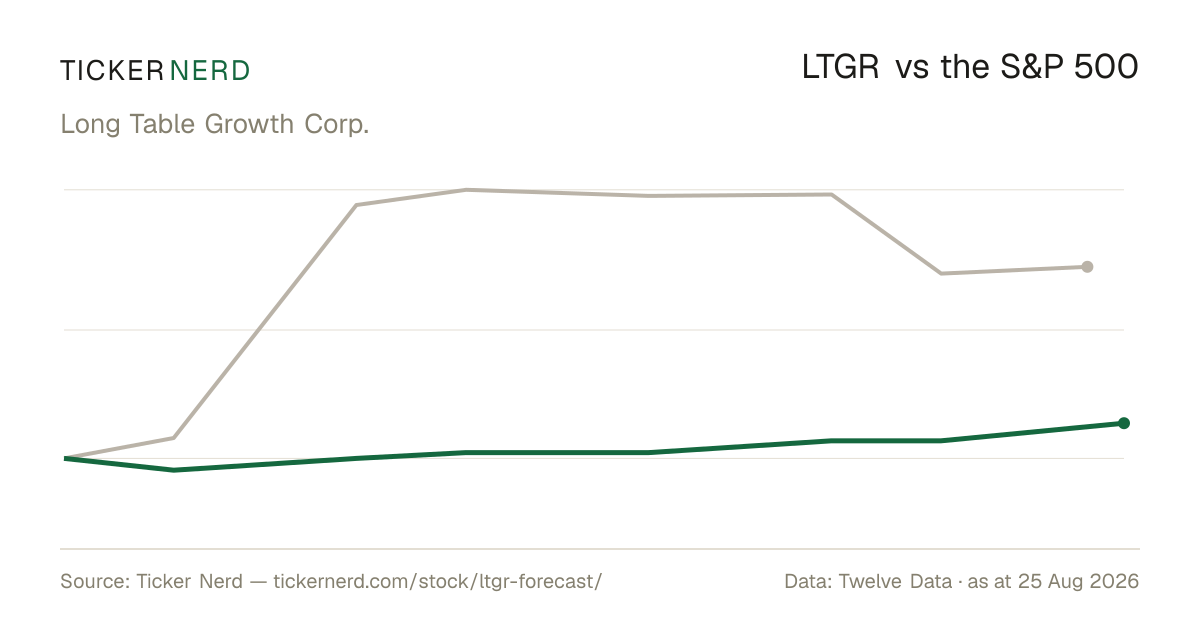
LTGR vs the S&P 500
Both lines are total return — dividends reinvested — so the comparison is honest on both sides.
Download this chart as an image — free to reuse; link this page as the source.
Data provided by Twelve Data
LTGR analyst estimate revisions
Not the forecast itself — the direction analysts are revising it. Revision direction is one of the model's factor families.
Long Table Growth Corp. (LTGR) financial data
A margin means little on its own. Each bar marks where the figure sits across the whole US universe we score.
- Trailing P/E
- —
- Price / sales
- —
- Price / book
- 0.6×
- EV / EBITDA
- —
Cheaper than 81% of US stocks
- Revenue growth (YoY)
- —
- Earnings growth (YoY)
- —
- Gross margin
- —
- Operating margin
- 0.0%
- Net margin
- 0.0%
Higher than 32% of US stocks
Higher than 30% of US stocks
- Return on equity
- —
- Return on assets
- —
- Dividend yield
- 0.0%
Higher than 1% of US dividend payers
Bars mark the percentile across the ~4,600 US stocks Ticker Nerd covers, among those reporting the figure.
Long Table Growth Corp. (LTGR) statistics: revenue, profit & scale
The headline figures, each with its date. Every row carries its own link — cite it straight from here.
Long Table Growth Corp. has a market value of $229.1M and an enterprise value of −$1.4B.
Forward dividend yield: 0.00%.
Long Table Growth Corp. employs 0 people.
Data provided by Twelve Data
LTGR vs competitors
The nearest names by industry and size, scored by the same model — like for like.
| Company | Market cap | TKN rank |
|---|---|---|
| LTGRLong Table Growth Corp. | $229.1M | 8 |
| HLXCHelix Acquisition Corp. III | $229.4M | 10 |
| TVIVTexas Ventures Acquisition IV Corp. | $228.8M | 7 |
| IRABIris Acquisition Corp. II | $227.4M | 8 |
| BIIIBlack Spade Acquisition III Co. | $232.1M | 17 |
| DGACDisciplined Growth Acquisition Corp. | $226.4M | 13 |
| SUMASUMA Acquisition Corp. | $226.1M | 10 |
Look up any of the roughly 4,600 stocks we score.
The rank is the raw material. Whether the rules would actually own Long Table Growth Corp. — and when they’d sell — is the membership. See the Ticker Nerd 20 →
Frequently asked questions about LTGR stock
How does Ticker Nerd's model rank LTGR?
As at 14 Oct 2026, Long Table Growth Corp. ranks 8 out of 100 on Ticker Nerd's systematic factor model — a percentile across roughly 4,600 US stocks, built from its factor families. Its strongest factor family is Size (65 of 100).
What is the LTGR stock forecast for 2030?
No analyst covering Long Table Growth Corp. publishes a 2030 price target — Wall Street targets run 12 to 18 months out. Sites quoting a 2030 price for LTGR are extrapolating price history, which says nothing about the business.
What does Long Table Growth Corp. do?
Long Table Growth Corp. Class A Ordinary Shares is a class of equity securities issued by Long Table Growth Corp., a blank check company focused on completing a merger or similar business combination with one or more operating businesses.
About Long Table Growth Corp.
Long Table Growth Corp. Class A Ordinary Shares is a class of equity securities issued by Long Table Growth Corp., a blank check company focused on completing a merger or similar business combination with one or more operating businesses. The shares represent the company’s public Class A equity and carry voting rights, while also reflecting the structure commonly used by special purpose acquisition companies. Long Table Growth Corp. currently operates as a financial-market vehicle centered on identifying and combining with a private company, rather than running a traditional commercial business. Its securities trade alongside related warrants and units, making the share class part of a broader capital structure used in SPAC transactions. In the market, Long Table Growth Corp. Class A Ordinary Shares serves investors seeking exposure to a pre-combination acquisition vehicle with a defined corporate purpose in the public markets.
CEO Mr. Gregory D. Ethridge CPA · United States · https://longtablepartners.com