MANHMANHTechnology · Software - Application

MANH Stock Forecast: Manhattan Associates, Inc. Price Predictions for 2026-2027

Last close, 14 Aug 2026
$197
−1.76% on the day

The 12 Wall Street analysts covering Manhattan Associates, Inc. hold a median 12-month price target of $210 — +6.4% from the last close. Ticker Nerd's systematic factor model, run across ~4,600 US stocks, ranks it 85 of 100 as at 15 Aug 2026 — inside the top quartile. Here, the model and the Street point the same way.

Market cap
$11.5B
Ticker Nerd rank
85 / 100
Median analyst target
$210
Analysts covering
12
Total return, dividends reinvested
1W
+1.1%
1M
+24.5%
YTD
+13.9%
1Y
−8.3%
From 52W high
−10.0%
From 52W low
+63.3%
$121
$219
52-week range, adjusted closes · the dot is the last close
Ticker Nerd rank

MANH stock analysis: one number for the whole business

Consensus tells you what everyone already believes. The model scores Manhattan Associates, Inc. on its factor families — the same systematic rank behind the Ticker Nerd portfolio.

Where the model ranks itAs at 15 Aug 2026
85 / 100

Percentile across ~4,600 US stocks on Ticker Nerd’s systematic factor model. Higher is better. How the model is built and tested

Quality
95
Revisions
94
Accruals
94
Volatility
78
Issuance
72
Momentum
51
Value
48
Growth
32
Size
14

Quality (95): The business earns solid, repeatable profits on what it owns.

Growth (32): Sales and profits are flat, shrinking, or growing more slowly than they were.

Size (14): Larger than most of the companies we track — more scrutinised, less often mispriced.

Built and run by Aslam Ghouse, an ex-Goldman Sachs quant trader with fourteen years in markets.

Wall Street

MANH stock forecast 2026-2027: analyst price targets & predictions

The bullish and bearish analyst opinions on MANH, reported as data — targets and ratings, the market's view beside the model's.

Share price and the analyst range, 12 monthsAdjusted close, US dollars
$120$140$160$180$200$220$240Oct 25Jan 26Apr 26Jul 26MANHHigh $240Median $210Low $180

Price targets and ratings are third-party analyst estimates, reported here as data. They are not Ticker Nerd forecasts, and they are frequently wrong.

What Wall Street says12 analysts
9 Buy3 Hold0 Sell
Low $180Median $210High $240

The green dot is the last close — the median target sits +6.4% from it.

Recent analyst actionsNewest first

Of the 20 most recent actions, 5 moved their price target up and 1 moved it down.

DateFirmActionRatingTarget
29 July 2026BairdMaintainsOutperform$186$218
29 July 2026DA DavidsonMaintainsBuy$200$210
29 July 2026Loop CapitalUpgradeBuy$150$215
29 July 2026StifelMaintainsBuy$200$225
21 July 2026CitigroupMaintainsBuy$177$193
21 July 2026CitigroupMaintainsBuy
29 May 2026BarclaysMaintainsOverweight$239$201
29 May 2026BarclaysMaintainsOverweight
20 May 2026DA DavidsonMaintainsBuy
23 Apr 2026BarclaysMaintainsOverweight
22 Apr 2026BairdMaintainsOutperform
22 Apr 2026CitigroupMaintainsBuy
22 Apr 2026DA DavidsonMaintainsBuy
22 Apr 2026StifelMaintainsBuy
16 Mar 2026BarclaysMaintainsOverweight
28 Jan 2026DA DavidsonMaintainsBuy
23 Jan 2026StifelMaintainsBuy
15 Jan 2026CitigroupUpgradeBuy
12 Jan 2026BarclaysMaintainsOverweight
5 Jan 2026Morgan StanleyMaintainsEqual-Weight

Price targets and ratings are third-party analyst estimates, reported here as data. They are not Ticker Nerd forecasts, and they are frequently wrong.

Market Radar

This page is one stock. Monday covers all of them.

Computed off the Friday close and sent before the US open.

Market Radar reports the week’s largest rank changes across roughly 4,600 US stocks, the factor behind each one, and where the market went. MANH appears on the weeks it earns a place.

Free, every Monday. Unsubscribe any time.

Estimates

MANH analyst estimate revisions

Not the forecast itself — the direction analysts are revising it. Revision direction is one of the model's factor families.

Which way the estimates are movingNext fiscal year
EPS revision, 90 days
+2.3%
Analysts raising
1
Analysts cutting
0
Fundamentals

Manhattan Associates, Inc. (MANH) financial data

A margin means little on its own. Each bar marks where the figure sits across the whole US universe we score.

Valuation
Trailing P/E
56.6×

Cheaper than 13% of US stocks

Price / sales
10.2×

Cheaper than 14% of US stocks

Price / book
73.1×

Cheaper than 2% of US stocks

EV / EBITDA
39.4×

Cheaper than 7% of US stocks

Growth & margins
Revenue growth (YoY)
9.3%

Higher than 51% of US stocks

Earnings growth (YoY)
−11.3%

Higher than 25% of US stocks

Gross margin
56.5%

Higher than 70% of US stocks

Operating margin
25.0%

Higher than 84% of US stocks

Net margin
18.7%

Higher than 81% of US stocks

Returns & dividend
Return on equity
96.4%

Higher than 96% of US stocks

Return on assets
24.4%

Higher than 99% of US stocks

Dividend yield

Bars mark the percentile across the ~4,600 US stocks Ticker Nerd covers, among those reporting the figure.

Peers

MANH vs competitors

The nearest names by industry and size, scored by the same model — like for like.

Its peer group, ranked by the same modelSoftware - Application
CompanyMarket capTKN rank
MANHManhattan Associates, Inc.$11.5B
85
CHYMChime Financial, Inc.$12.3B
37
DOCUDocuSign, Inc.$12.4B
85
FROGJFrog Ltd.$11.4B
78
HUBSHubSpot, Inc.$11.2B
92
BSYBentley Systems, Inc.$11.0B
68
FIGFigma, Inc.$13.3B
19

Look up any of the roughly 4,600 stocks we score.

The rank is the raw material. Whether the rules would actually own Manhattan Associates, Inc. — and when they’d sell — is the membership. See the Ticker Nerd 20 →

News

Latest MANH news & analysis

Manhattan Associates (MANH) Now Trades Above Golden Cross: Time to Buy?

Zacks Investment Research · 7 Aug 2026positive

Manhattan Associates (MANH) reached a significant support level, and its 50-day simple moving average rose above its 200-day moving average, a technical pattern known as a "golden cross." Zacks notes this development could make MANH a good pick from a technical perspective.

Why it matters — A MANH watcher would care because the golden cross is a widely followed technical signal that is often seen as indicating a potential shift to positive momentum in the stock.

Manhattan Associates (MANH) is a Top-Ranked Momentum Stock: Should You Buy?

Zacks Investment Research · 7 Aug 2026positive

Zacks Investment Research highlights Manhattan Associates (MANH) as a top-ranked momentum stock, referencing its Zacks Style Scores as a tool for identifying strong, market-beating stocks. The article poses the question of whether investors should buy the stock.

Why it matters — A top-ranked momentum designation could signal renewed investor attention on MANH's stock performance relative to peers.

Manhattan Associates: The Next Chapter Is Already Priced In

Seeking Alpha · 30 July 2026neutral

A Seeking Alpha analysis notes that Manhattan Associates, a provider of supply chain optimization software, has underperformed tech and mid-cap benchmarks since August 2024 despite a recent 20%+ single-day gain, and reiterates a Hold rating due to its high earnings multiple and slowing free cash flow conversion.

Why it matters — MANH watchers would care because the analysis suggests the company's recent stock surge may already reflect its forward prospects, while underlying concerns about valuation and cash flow remain.

Oil Spikes 7%, Nasdaq 100 Sinks Before Fed: Stock Market Today

Benzinga · 29 July 2026negative

The article reports a deepening sell-off on Wall Street as crude oil spiked 7% on fresh U.S.-Iran tensions ahead of the Federal Reserve's rate decision, dragging the S&P 500 to four-week lows and sending the Nasdaq 100 more than 10% below prior records.

Why it matters — As a technology and software company, MANH's stock can be affected by broad market sell-offs and tech-sector declines like the Nasdaq 100 drop described.

MANH Q2 Earnings Beat Estimates, Cloud Growth Fuels Revenues

Zacks Investment Research · 29 July 2026positive

Manhattan Associates surpassed Q2 earnings estimates as cloud revenues rose 26%, driving higher sales and profitability and prompting an upward revision to 2026 guidance.

Why it matters — The results show cloud revenue momentum and raised forward guidance, two key indicators for investors tracking MANH's growth trajectory.

FAQ

Frequently asked questions about MANH stock

What is the MANH stock price forecast for 2026-2027?

The 12 Wall Street analysts covering Manhattan Associates, Inc. have a median 12-month price target of $210, with estimates ranging from $180 to $240. These are third-party analyst estimates, not Ticker Nerd forecasts, and they are frequently wrong.

Is MANH stock a buy right now?

Of the 12 analysts covering Manhattan Associates, Inc., 9 rate it a Buy, 3 a Hold and 0 a Sell. Ticker Nerd's systematic factor model ranks Manhattan Associates, Inc. 85 out of 100 across roughly 4,600 US stocks as at 15 Aug 2026. None of this is personal advice — it does not consider your circumstances.

How does Ticker Nerd's model rank MANH?

As at 15 Aug 2026, Manhattan Associates, Inc. ranks 85 out of 100 on Ticker Nerd's systematic factor model — a percentile across roughly 4,600 US stocks, built from its factor families. Its strongest factor family is Quality (95 of 100).

Will MANH stock go up?

No one can know that. What the data says: the median 12-month target from 12 analysts implies +6.4% from the last close, and Ticker Nerd's factor model ranks Manhattan Associates, Inc. 85 out of 100 as at 15 Aug 2026. Analyst targets are third-party estimates and frequently wrong; none of this is personal advice.

What is the MANH stock forecast for 2030?

No analyst covering Manhattan Associates, Inc. publishes a 2030 price target — Wall Street targets run 12 to 18 months out. Sites quoting a 2030 price for MANH are extrapolating price history, which says nothing about the business. The furthest attributed numbers are the current analyst targets: $180 to $240 over the next 12 months.

How has MANH stock performed over the past year?

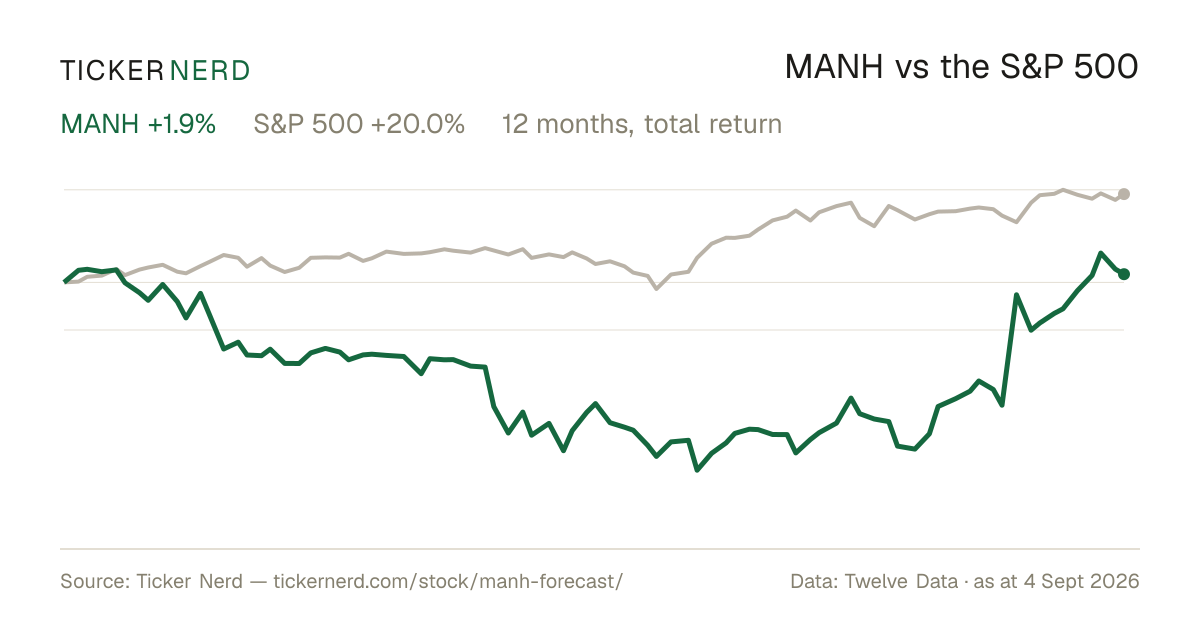
Manhattan Associates, Inc. returned -8.3% over the 12 months to 14 Aug 2026, with dividends reinvested. Past performance does not indicate future returns.

What does Manhattan Associates, Inc. do?

Manhattan Associates Inc. is a software company that develops, sells, deploys, services, and maintains solutions for supply chain, inventory, and omnichannel operations.

What is the latest news on MANH?

The most recent item we track (Zacks Investment Research, 7 Aug 2026): "Manhattan Associates (MANH) Now Trades Above Golden Cross: Time to Buy?". Manhattan Associates (MANH) reached a significant support level, and its 50-day simple moving average rose above its 200-day moving average, a technical pattern known as a "golden cross." Zacks notes this development could make MANH a good pick from a technical perspective.

Company

About Manhattan Associates, Inc.

Manhattan Associates Inc. is a software company that develops, sells, deploys, services, and maintains solutions for supply chain, inventory, and omnichannel operations. The company’s products support warehouse management, transportation management, order management, store fulfillment, inventory visibility, labor management, and related supply chain execution functions. Its software is used by retailers, wholesalers, manufacturers, logistics providers, and other organizations that need to coordinate complex distribution and fulfillment networks. Manhattan Associates also offers services and support that help customers implement and maintain these systems across global operations. Headquartered in Atlanta, Georgia, the company serves clients across North and Latin America, Europe, the Middle East and Africa, and Asia Pacific, making it a notable provider of enterprise software for modern supply chain commerce.

CEO Mr. Eric A. Clark · 4,100 employees · United States · https://www.manh.com