MSTRMSTRTechnology · Software - Application

MSTR Stock Forecast: Strategy, Inc. Price Predictions for 2026-2027

Last close, 15 Sept 2026
$130
−5.36% on the day

The 16 Wall Street analysts covering Strategy, Inc. hold a median 12-month price target of $200 — +54.3% from the last close. Ticker Nerd's systematic factor model, run across ~4,600 US stocks, ranks it 26 of 100 as at 14 Sept 2026 — in the lower half. The Street sees upside; the factor read is a caution. That gap is the story on this page.

Market cap
$54.4B
Ticker Nerd rank
26 / 100
Median analyst target
$200
Analysts covering
16
Revenue$122.4M+6.9% y/y
Operating income−$15.6M
Net income−$8.2B
Free cash flow−$6.4B
Quarterly, 8 quarters to 30 June 2026 · latest quarter's figure shown
Total return, dividends reinvested
1W
−5.1%
1M
+39.3%
YTD
−14.7%
1Y
−60.5%
From 52W high
−64.0%
From 52W low
+57.5%
$82
$360
52-week range, adjusted closes · the dot is the last close
Ticker Nerd rank

MSTR stock analysis: one number for the whole business

Consensus tells you what everyone already believes. The model scores Strategy, Inc. on its factor families — the same systematic rank behind the Ticker Nerd portfolio.

Where the model ranks itAs at 14 Sept 2026
26 / 100

Percentile across ~4,600 US stocks on Ticker Nerd’s systematic factor model. Higher is better. How the model is built and tested

Accruals
87
Volatility
66
Issuance
52
Growth
48
Revisions
43
Value
37
Quality
33
Momentum
12
Size
5

Accruals (87): Reported profit is backed by cash, and the company is not expanding recklessly.

Momentum (12): The shares have been drifting down relative to others.

Size (5): Larger than most of the companies we track — more scrutinised, less often mispriced.

Built and run by Aslam Ghouse, an ex-Goldman Sachs quant trader with fourteen years in markets.

Wall Street

MSTR stock forecast 2026-2027: analyst price targets & predictions

The bullish and bearish analyst opinions on MSTR, reported as data — targets and ratings, the market's view beside the model's.

Share price and the analyst range, 12 monthsAdjusted close, US dollars
$100$200$300$400$500Oct 25Jan 26Apr 26Jul 26MSTRHigh $435Median $200Low $125

Price targets and ratings are third-party analyst estimates, reported here as data. They are not Ticker Nerd forecasts, and they are frequently wrong.

Data provided by Twelve Data

What Wall Street says16 analysts
15 Buy1 Hold0 Sell
Low $125Median $200High $435

The green dot is the last close — the median target sits +54.3% from it.

Recent analyst actionsNewest first

Of the 20 most recent actions, 3 moved their price target up and 5 moved it down.

DateFirmActionRatingTarget
8 Sept 2026Canaccord GenuityMaintainsBuy$175$179
3 Sept 2026B. Riley SecuritiesMaintainsBuy$155$175
2 Sept 2026Alliance Global PartnersInitiatesBuy$217
26 Aug 2026BernsteinMaintainsOutperform$450$350
26 Aug 2026BernsteinMaintainsOutperform
25 Aug 2026Canaccord GenuityMaintainsBuy
25 Aug 2026Canaccord GenuityMaintainsBuy$130$175
3 Aug 2026B. Riley SecuritiesMaintainsBuy$215$155
3 Aug 2026B. Riley SecuritiesMaintainsBuy
3 Aug 2026BarclaysMaintainsOverweight
3 Aug 2026BarclaysMaintainsOverweight$130$125
3 Aug 2026Cantor FitzgeraldMaintainsOverweight
3 Aug 2026Cantor FitzgeraldMaintainsOverweight$212$186
31 July 2026BenchmarkMaintainsBuy$570$435
31 July 2026BenchmarkMaintainsBuy
31 July 2026BTIGReiteratesBuy
31 July 2026BTIGReiteratesBuy$250
8 July 2026BarclaysInitiatesOverweight
8 July 2026BarclaysInitiatesOverweight$130
7 July 2026MizuhoMaintainsOutperform

Price targets and ratings are third-party analyst estimates, reported here as data. They are not Ticker Nerd forecasts, and they are frequently wrong.

Market Radar

This page is one stock. Monday covers all of them.

Computed off the Friday close and sent before the US open.

Market Radar reports the week’s largest rank changes across roughly 4,600 US stocks, the factor behind each one, and where the market went. MSTR appears on the weeks it earns a place.

Free, every Monday. Unsubscribe any time.

Performance

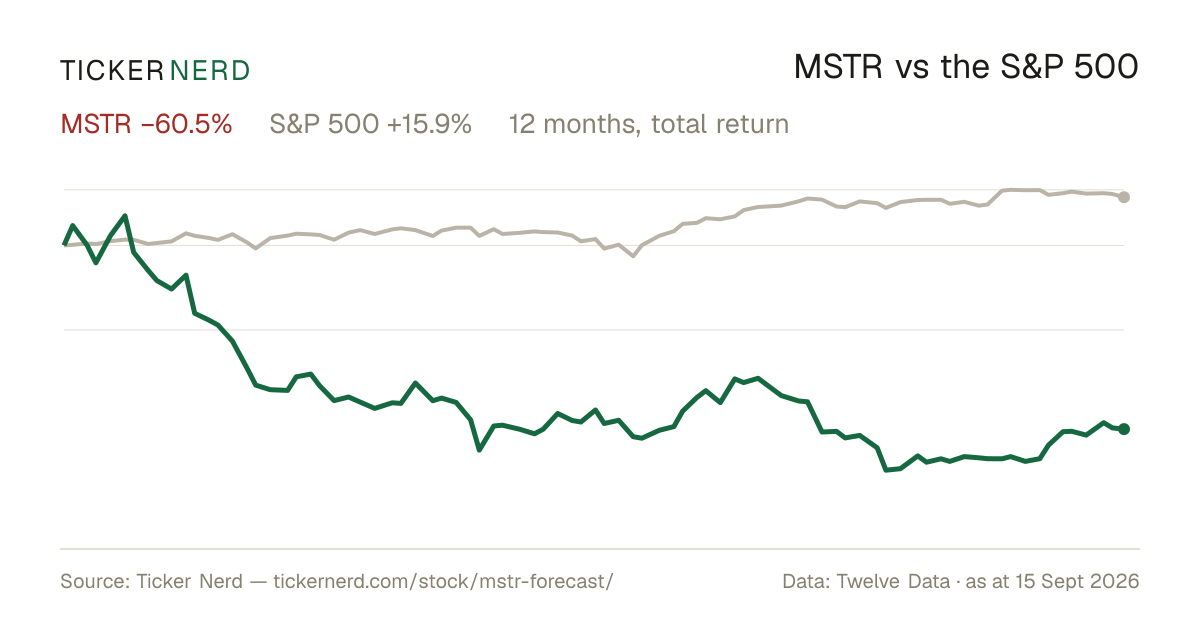
MSTR vs the S&P 500

Both lines are total return — dividends reinvested — so the comparison is honest on both sides.

Over the twelve months to 15 Sept 2026, Strategy, Inc. returned −60.5% against +16.4% for the S&P 500, dividends included.

MSTR vs S&P 500, last 12 monthsTotal return, rebased to 100
20406080100120Oct 25Jan 26Apr 26Jul 26MSTRS&P 500

Download this chart as an image — free to reuse; link this page as the source.

Data provided by Twelve Data

Estimates

MSTR analyst estimate revisions

Not the forecast itself — the direction analysts are revising it. Revision direction is one of the model's factor families.

Which way the estimates are movingNext fiscal year
EPS revision, 90 days
−217.0%
Analysts raising
0
Analysts cutting
6
Fundamentals

Strategy, Inc. (MSTR) financial data

A margin means little on its own. Each bar marks where the figure sits across the whole US universe we score.

Valuation
Trailing P/E
5.5×

Cheaper than 65% of US stocks

Price / sales
109.2×

Cheaper than 4% of US stocks

Price / book
1.6×

Cheaper than 52% of US stocks

EV / EBITDA
−2.0×

Cheaper than 71% of US stocks

Growth & margins
Revenue growth (YoY)
6.9%

Higher than 44% of US stocks

Earnings growth (YoY)
6.9%

Higher than 44% of US stocks

Gross margin
66.6%

Higher than 80% of US stocks

Operating margin
−6808.1%

Higher than 2% of US stocks

Net margin
68.7%

Higher than 98% of US stocks

Returns & dividend
Return on equity
−63.6%

Higher than 18% of US stocks

Return on assets
−38.7%

Higher than 11% of US stocks

Dividend yield

Bars mark the percentile across the ~4,600 US stocks Ticker Nerd covers, among those reporting the figure.

Key statistics

Strategy, Inc. (MSTR) statistics: revenue, profit & scale

The headline figures, each with its date. Every row carries its own link — cite it straight from here.

  • Strategy, Inc. has a market value of $54.4B and an enterprise value of $71.4B.

  • Revenue in the twelve months to 30 June 2026: $498.3M. The latest quarter grew 6.9% year on year.

  • Net income over the same four quarters: −$30.4B, a −6103.0% net margin.

  • Diluted earnings per share, trailing twelve months: $−97.21.

  • Free cash flow in the twelve months to 30 June 2026: −$21.7B.

  • Strategy, Inc. spent $952.4M on dividends in the twelve months to 30 June 2026.

  • Shares outstanding: 371.6M.

  • Trailing P/E: 5.5×; forward P/E: 2.8× — the forward figure prices analyst consensus estimates, not reported earnings.

  • Strategy, Inc. employs 1,539 people $324K of revenue per employee.

Statement figures: company filings via Twelve Data, four quarters to 30 June 2026 · market figures as at 15 Sept 2026

Data provided by Twelve Data

Peers

MSTR vs competitors

The nearest names by industry and size, scored by the same model — like for like.

Its peer group, ranked by the same modelSoftware - Application
CompanyMarket capTKN rank
MSTRStrategy, Inc.$54.4B
26
TEAMAtlassian Corp.$50.8B
81
ADSKAutodesk, Inc.$48.5B
76
WDAYWorkday, Inc.$48.5B
88
PAYXPaychex, Inc.$42.5B
87
ROPRoper Technologies, Inc.$39.8B
62
CDNSCadence Design Systems, Inc.$76.0B
48

Look up any of the roughly 4,600 stocks we score.

The rank is the raw material. Whether the rules would actually own Strategy, Inc. — and when they’d sell — is the membership. See the Ticker Nerd 20 →

News

Latest MSTR news & analysis

The Price of Bitcoin May Be Soaring, But a New Risk Has Emerged for Strategy. Here's What MSTR Investors Need to Know.

The Motley Fool · 15 Sept 2026negative

Strategy has issued four classes of preferred stock to fund its Bitcoin purchases, but is now selling some of its Bitcoins to fund the dividends on those preferred shares. This introduces a new risk despite Bitcoin's rising price.

Why it matters — MSTR watchers would care because selling Bitcoin to cover preferred dividends could reduce the company's core Bitcoin holdings, potentially undermining the strategy that underpins its value.

Strategy (MSTR) stock falls 5% as Clarity Act stalls

Invezz · 15 Sept 2026negative

Strategy Inc. (formerly MicroStrategy) shares fell 5% on Tuesday as Bitcoin declined after the US Senate failed to advance the Digital Asset Market Clarity Act. The vote was a setback for comprehensive cryptocurrency legislation backed by Republicans and major digital asset industry players.

Why it matters — A MSTR watcher would care because the company's stock is closely tied to Bitcoin prices, and the stalled legislation weighed on the cryptocurrency market.

Clarity Act Fails Key Senate Vote: What's Next for Bitcoin, Other Crypto Assets?

Schwab Network · 15 Sept 2026neutral

The Clarity Act failed to clear a key procedural vote in the Senate, a development that was followed by a decline in Bitcoin near the end of Tuesday's trading session. A commentator downplayed the vote as a significant headwind for crypto.

Why it matters — A MSTR watcher would care because regulatory developments affecting Bitcoin can influence sentiment around the crypto market in which the company is closely tied.

Top Performing Leveraged/Inverse ETFs: 09/13/2026

ETF Trends · 15 Sept 2026neutral

ETF Trends reported the top-performing leveraged and inverse ETFs for the week ending September 13, 2026, noting that leveraged and inverse funds can move quickly due to their structure. The piece highlights specific top-performing funds from that period.

Why it matters — Strategy, Inc. (MSTR) watchers would care because leveraged and inverse ETFs frequently track MSTR's price, so its trading activity and volatility are often reflected in these fund rankings.

Senate Votes to Block Crypto Bill in Major Blow to the Industry

NYTimes · 15 Sept 2026neutral

The Senate blocked the Clarity Act, a landmark crypto bill, after Democrats raised concerns about President Trump's personal investments in the crypto industry. This stalled the legislation, which was seen as important for the broader cryptocurrency sector.

Why it matters — As a major crypto holder, MSTR and its investors could be affected by regulatory developments that shape the legal environment for digital assets.

FAQ

Frequently asked questions about MSTR stock

What is the MSTR stock price forecast for 2026-2027?

The 16 Wall Street analysts covering Strategy, Inc. have a median 12-month price target of $200, with estimates ranging from $125 to $435. These are third-party analyst estimates, not Ticker Nerd forecasts, and they are frequently wrong.

Is MSTR stock a buy right now?

Of the 16 analysts covering Strategy, Inc., 15 rate it a Buy, 1 a Hold and 0 a Sell. Ticker Nerd's systematic factor model ranks Strategy, Inc. 26 out of 100 across roughly 4,600 US stocks as at 14 Sept 2026. None of this is personal advice — it does not consider your circumstances.

How does Ticker Nerd's model rank MSTR?

As at 14 Sept 2026, Strategy, Inc. ranks 26 out of 100 on Ticker Nerd's systematic factor model — a percentile across roughly 4,600 US stocks, built from its factor families. Its strongest factor family is Accruals (87 of 100).

Will MSTR stock go up?

No one can know that. What the data says: the median 12-month target from 16 analysts implies +54.3% from the last close, and Ticker Nerd's factor model ranks Strategy, Inc. 26 out of 100 as at 14 Sept 2026. Analyst targets are third-party estimates and frequently wrong; none of this is personal advice.

What is the MSTR stock forecast for 2030?

No analyst covering Strategy, Inc. publishes a 2030 price target — Wall Street targets run 12 to 18 months out. Sites quoting a 2030 price for MSTR are extrapolating price history, which says nothing about the business. The furthest attributed numbers are the current analyst targets: $125 to $435 over the next 12 months.

How has MSTR stock performed over the past year?

Strategy, Inc. returned -60.5% over the 12 months to 15 Sept 2026, with dividends reinvested. Past performance does not indicate future returns.

What does Strategy, Inc. do?

Strategy Inc is a bitcoin treasury company and enterprise analytics software provider focused on delivering AI-powered data tools and financial exposure products. The company offers Strategy One, a cloud-based analytics platform that helps non-technical users access insights for decision-making, and Strategy Mosaic, which provides a consistent intelligence layer across diverse data sources and governance environments.

What is the latest news on MSTR?

The most recent item we track (The Motley Fool, 15 Sept 2026): "The Price of Bitcoin May Be Soaring, But a New Risk Has Emerged for Strategy. Here's What MSTR Investors Need to Know.". Strategy has issued four classes of preferred stock to fund its Bitcoin purchases, but is now selling some of its Bitcoins to fund the dividends on those preferred shares. This introduces a new risk despite Bitcoin's rising price.

Company

About Strategy, Inc.

Strategy Inc is a bitcoin treasury company and enterprise analytics software provider focused on delivering AI-powered data tools and financial exposure products. The company offers Strategy One, a cloud-based analytics platform that helps non-technical users access insights for decision-making, and Strategy Mosaic, which provides a consistent intelligence layer across diverse data sources and governance environments. Alongside its software business, Strategy Inc issues securities designed to give investors varying degrees of economic exposure to Bitcoin through equity and fixed income instruments. Its current operations span the United States, Europe, the Middle East, Africa, and other international markets, positioning the company at the intersection of digital asset treasury management and business intelligence software.

CEO Mr. Phong Q. Le · 1,539 employees · United States · https://www.strategy.com