NBRGFinancial Services · Shell Companies

NBRG Stock Forecast: Newbridge Acquisition Ltd. Price Predictions for 2026-2027

Last close, 16 Oct 2026
$10
+0.20% on the day

Ticker Nerd's systematic factor model, run across ~4,600 US stocks, ranks it 13 of 100 as at 22 Oct 2026 — in the weakest quartile.

Market cap
$76.3M
Ticker Nerd rank
13/ 100
Median analyst target
—
Analysts covering
—
Revenue$0.0
Operating income−$190K
Net income$289K
Free cash flow−$190K
Quarterly, 7 quarters to 30 June 2026 · latest quarter's figure shown
Total return, dividends reinvested
1W
+0.2%
1M
+0.2%
From high
0.0%
From low
+2.4%
$10
$10
Range since 23 Mar 2026, adjusted closes · the dot is the last close
Ticker Nerd rank

NBRG stock analysis: one number for the whole business

Consensus tells you what everyone already believes. The model scores Newbridge Acquisition Ltd. on its factor families — the same systematic rank behind the Ticker Nerd portfolio.

Where the model ranks itAs at 22 Oct 2026
13/ 100

Percentile across ~4,600 US stocks on Ticker Nerd’s systematic factor model. Higher is better. How the model is built and tested

Size
76
Volatility
57
Momentum
55
Value
44
Quality
28
Revisions
25
Growth
16
Accruals
8
Issuance
7

Size (76): Smaller than most of the companies we track.

Issuance (7): The company has been issuing shares or taking on financing, diluting existing holders.

Built and run by Aslam Ghouse, an ex-Goldman Sachs quant trader with fourteen years in markets.

Wall Street

NBRG stock forecast 2026-2027: analyst price targets & predictions

The bullish and bearish analyst opinions on NBRG, reported as data — targets and ratings, the market's view beside the model's.

Share price and the analyst range, since 23 Mar 2026Adjusted close, US dollars
$10$10$10$10$10$10Apr 26May 26Jun 26Jul 26Aug 26Sep 26Oct 26NBRG

Price targets and ratings are third-party analyst estimates, reported here as data. They are not Ticker Nerd forecasts, and they are frequently wrong.

Data provided by Twelve Data

Price targets and ratings are third-party analyst estimates, reported here as data. They are not Ticker Nerd forecasts, and they are frequently wrong.

Market Radar

This page is one stock. Monday covers all of them.

NBRG appears in the Radar on the weeks it earns a place.

  • Market Radar, every Monday: the week's biggest rank moves across ~4,600 US stocks, and the reason for each.
  • The AI build-out map, free: every AI company we track, part by part, and one part in full with each verdict.
  • The AI build-out, every Wednesday: how AI stocks did, part by part.

Free. Unsubscribe any time.

Performance

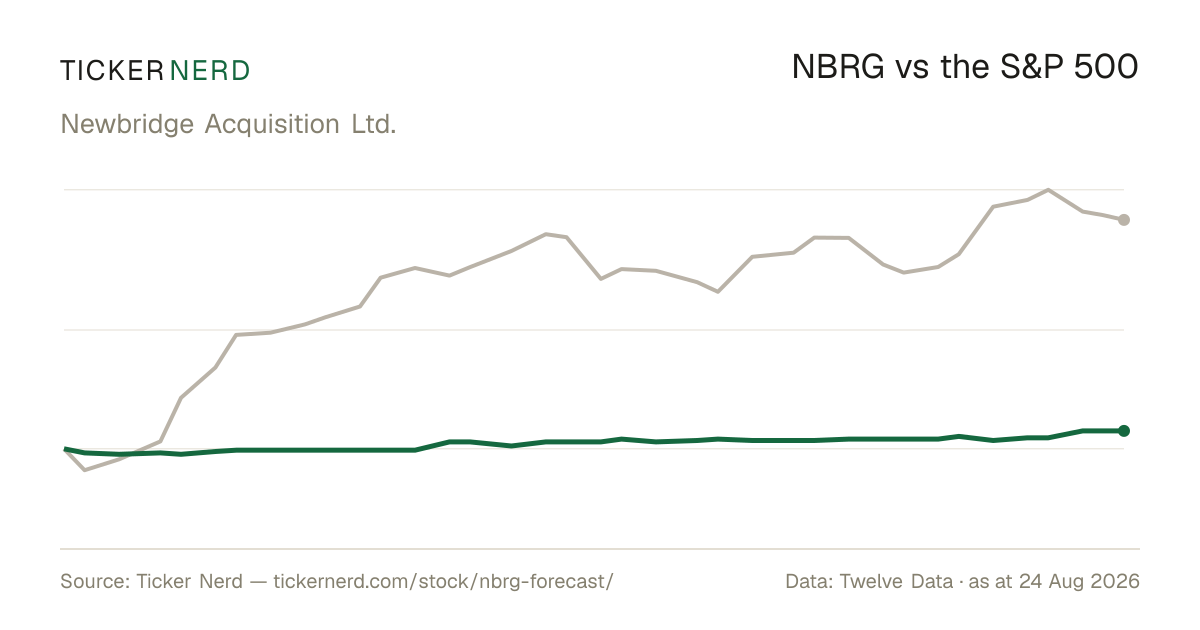
NBRG vs the S&P 500

Both lines are total return — dividends reinvested — so the comparison is honest on both sides.

NBRG vs S&P 500, last 12 monthsTotal return, rebased to 100
95100105110115120Apr 26May 26Jun 26Jul 26Aug 26Sep 26Oct 26NBRGS&P 500

Download this chart as an image — free to reuse; link this page as the source.

Data provided by Twelve Data

Estimates

NBRG analyst estimate revisions

Not the forecast itself — the direction analysts are revising it. Revision direction is one of the model's factor families.

Fundamentals

Newbridge Acquisition Ltd. (NBRG) financial data

A margin means little on its own. Each bar marks where the figure sits across the whole US universe we score.

Valuation
Trailing P/E
252.8×

Cheaper than 3% of US stocks

Price / sales
—
Price / book
18.2×

Cheaper than 5% of US stocks

EV / EBITDA
−347.8×

Cheaper than 98% of US stocks

Growth & margins
Revenue growth (YoY)
—
Earnings growth (YoY)
—
Gross margin
—
Operating margin
0.0%

Higher than 32% of US stocks

Net margin
0.0%

Higher than 30% of US stocks

Returns & dividend
Return on equity
13.5%

Higher than 72% of US stocks

Return on assets
−1.1%

Higher than 39% of US stocks

Dividend yield
0.0%

Higher than 1% of US dividend payers

Bars mark the percentile across the ~4,600 US stocks Ticker Nerd covers, among those reporting the figure.

Key statistics

Newbridge Acquisition Ltd. (NBRG) statistics: revenue, profit & scale

The headline figures, each with its date. Every row carries its own link — cite it straight from here.

  • Newbridge Acquisition Ltd. has a market value of $76.3M and an enterprise value of $76.9M.

  • Revenue in the twelve months to 30 June 2026: $0.0.

  • Net income over the same four quarters: $253K.

  • Free cash flow in the twelve months to 30 June 2026: −$533K.

  • Shares outstanding: 7.5M.

  • Trailing P/E: 252.8×.

  • Forward dividend yield: 0.00%, paying out 0% of earnings.

  • Newbridge Acquisition Ltd. employs 0 people.

Statement figures: company filings via Twelve Data, four quarters to 30 June 2026 · market figures as at 22 Oct 2026

Data provided by Twelve Data

Peers

NBRG vs competitors

The nearest names by industry and size, scored by the same model — like for like.

Its peer group, ranked by the same modelShell Companies
CompanyMarket capTKN rank
NBRGNewbridge Acquisition Ltd.$76.3M13
CCCTColumbus Circle Capital Corp. III$75.8M5
BPACBlueport Acquisition Ltd.$75.6M22
SSEAStarry Sea Acquisition Corp.$80.0M29
RANGRange Capital Acquisition Corp.$73.0M80
MTNECH4 Natural Solutions Corp.$72.8M15
JATTJATT II Acquisition Corp.$80.3M11

Look up any of the roughly 4,600 stocks we score.

The rank is the raw material. Whether the rules would actually own Newbridge Acquisition Ltd. — and when they’d sell — is the membership. See the Ticker Nerd 20 →

News

Latest NBRG news & analysis

Newbridge Acquisition Limited Announces entering into the Business Combination Agreement with Startech Group Inc.

GlobeNewsWire · 3 Aug 2026positive

Newbridge Acquisition Limited announced the execution of a business combination agreement with Startech Group Inc., an emerging life sciences technology company developing functional water and AI-powered healthcare products aimed at enhancing human longevity.

Why it matters — A Newbridge Acquisition watcher would care because this agreement sets out the company's planned combination with Startech Group, moving Newbridge toward its announced business combination.

FAQ

Frequently asked questions about NBRG stock

How does Ticker Nerd's model rank NBRG?

As at 22 Oct 2026, Newbridge Acquisition Ltd. ranks 13 out of 100 on Ticker Nerd's systematic factor model — a percentile across roughly 4,600 US stocks, built from its factor families. Its strongest factor family is Size (76 of 100).

What is the NBRG stock forecast for 2030?

No analyst covering Newbridge Acquisition Ltd. publishes a 2030 price target — Wall Street targets run 12 to 18 months out. Sites quoting a 2030 price for NBRG are extrapolating price history, which says nothing about the business.

What does Newbridge Acquisition Ltd. do?

Newbridge Acquisition Limited Class A Ordinary Share is the publicly traded Class A equity of Newbridge Acquisition Limited, a blank check company based in Hong Kong. The share represents one component of the company’s capital structure and is used in the market as part of its special purpose acquisition company framework.

What is the latest news on NBRG?

The most recent item we track (GlobeNewsWire, 3 Aug 2026): "Newbridge Acquisition Limited Announces entering into the Business Combination Agreement with Startech Group Inc.". Newbridge Acquisition Limited announced the execution of a business combination agreement with Startech Group Inc., an emerging life sciences technology company developing functional water and AI-powered healthcare products aimed at enhancing human longevity.

Company

About Newbridge Acquisition Ltd.

Newbridge Acquisition Limited Class A Ordinary Share is the publicly traded Class A equity of Newbridge Acquisition Limited, a blank check company based in Hong Kong. The share represents one component of the company’s capital structure and is used in the market as part of its special purpose acquisition company framework. Newbridge Acquisition Limited is organized to pursue a business combination with an operating business through transactions such as a merger, share exchange, asset acquisition, share purchase, recapitalization, or reorganization. Its Class A shares are part of a broader set of securities that also includes rights associated with its unit structure. The company currently operates within the financial services and shell company segment, where SPAC entities serve as a financing vehicle for identifying and completing a future business combination.

CEO Mr. Yongsheng Liu · Hong Kong