NEOVNEOVIndustrials · Electrical Equipment & Parts

NEOV Stock Forecast: NeoVolta, Inc. Price Predictions for 2026-2027

Last close, 3 Aug 2026
$2.47
+17.06% on the day

The 4 Wall Street analysts covering NeoVolta, Inc. hold a median 12-month price target of $9.5 — +284.6% from the last close. Ticker Nerd's systematic factor model, run across ~4,600 US stocks, ranks it 37 of 100 as at 1 Aug 2026 — in the lower half. The Street sees upside; the factor read is a caution. That gap is the story on this page.

Market cap
$115.9M
Ticker Nerd rank
37 / 100
Median analyst target
$9.50
Analysts covering
4
Total return, dividends reinvested
1W
+13.3%
1M
−0.8%
YTD
−18.8%
1Y
−50.7%
From 52W high
−59.2%
From 52W low
+54.4%
$1.60
$6.06
52-week range, adjusted closes · the dot is the last close
Ticker Nerd rank

NEOV stock analysis: one number for the whole business

Consensus tells you what everyone already believes. The model scores NeoVolta, Inc. on its factor families — the same systematic rank behind the Ticker Nerd portfolio.

Where the model ranks itAs at 1 Aug 2026
37 / 100

Percentile across ~4,600 US stocks on Ticker Nerd’s systematic factor model. Higher is better. How the model is built and tested

Size
73
Volatility
62
Revisions
56
Issuance
52
Growth
48
Momentum
44
Value
32
Quality
32
Accruals
30

Size (73): Smaller than most of the companies we track.

Accruals (30): A large share of reported profit has not shown up as cash, or the balance sheet is expanding quickly — both tend to unwind.

The rank is the raw material. Whether the rules would actually own NeoVolta, Inc. — and when they’d sell — is the membership.

Wall Street

NEOV stock forecast 2026-2027: analyst price targets & predictions

The bullish and bearish analyst opinions on NEOV, reported as data — targets and ratings, the market's view beside the model's.

Share price and the analyst range, 12 monthsAdjusted close, US dollars
$0.00$5.00$10.00$15.00Oct 25Jan 26Apr 26Jul 26NEOVHigh $15.00Median $9.50Low $5.00

Price targets and ratings are third-party analyst estimates, reported here as data. They are not Ticker Nerd forecasts, and they are frequently wrong.

What Wall Street says4 analysts
3 Buy1 Hold0 Sell
Low $5.00Median $9.50High $15.00

The green dot is the last close — the median target sits +284.6% from it.

Recent analyst actionsNewest first
DateFirmActionRatingTarget
29 July 2026Northland Capital MarketsInitiatesOutperform$15
2 July 2026NeedhamMaintainsBuy$8.00
2 July 2026NeedhamMaintainsBuy
26 June 2026Lake StreetInitiatesBuy$11
26 June 2026Lake StreetInitiatesBuy
17 June 2026NeedhamInitiatesBuy
1 Oct 2025Maxim GroupDowngradeHold
13 Nov 2024Maxim GroupMaintainsBuy
1 Oct 2024Maxim GroupMaintainsBuy
15 Feb 2023Maxim GroupMaintainsBuy
14 Oct 2022Maxim GroupInitiatesBuy

Price targets and ratings are third-party analyst estimates, reported here as data. They are not Ticker Nerd forecasts, and they are frequently wrong.

Estimates

NEOV analyst estimate revisions

Not the forecast itself — the direction analysts are revising it. Revision direction is one of the model's factor families.

Fundamentals

NeoVolta, Inc. (NEOV) financial data

A margin means little on its own. Each bar marks where the figure sits across the whole US universe we score.

Valuation
Trailing P/E
−14.0×

Cheaper than 95% of US stocks

Price / sales
6.4×

Cheaper than 20% of US stocks

Price / book
4.1×

Cheaper than 26% of US stocks

EV / EBITDA
−17.3×

Cheaper than 88% of US stocks

Growth & margins
Revenue growth (YoY)
0.5%

Higher than 30% of US stocks

Earnings growth (YoY)
0.5%

Higher than 37% of US stocks

Gross margin
45.8%

Higher than 59% of US stocks

Operating margin
−129.7%

Higher than 13% of US stocks

Net margin
−63.4%

Higher than 8% of US stocks

Returns & dividend
Return on equity
−88.1%

Higher than 15% of US stocks

Return on assets
−37.4%

Higher than 11% of US stocks

Dividend yield

Bars mark the percentile across the ~4,600 US stocks Ticker Nerd covers, among those reporting the figure.

Peers

NEOV vs competitors

The nearest names by industry and size, scored by the same model — like for like.

Its peer group, ranked by the same modelElectrical Equipment & Parts
CompanyMarket capTKN rank
NEOVNeoVolta, Inc.$115.9M
37
RFILRF Industries Ltd.$132.0M
96
SKYXSKYX Platforms Corp.$143.4M
36
TGENTecogen, Inc.$99.3M
37
ULBIUltralife Corp.$86.4M
69
NMADNomad Power Solutions, Inc.$85.0M
29
EAFGrafTech International Ltd.$173.5M
17
Market Radar

This page is one stock. Monday covers all of them.

Computed off the Friday close and sent before the US open.

Market Radar reports the week’s largest rank changes across roughly 4,600 US stocks, the factor behind each one, and where the market went. NEOV appears on the weeks it earns a place.

Free, every Monday. Unsubscribe any time.

FAQ

Frequently asked questions about NEOV stock

What is the NEOV stock price forecast for 2026-2027?

The 4 Wall Street analysts covering NeoVolta, Inc. have a median 12-month price target of $9.5, with estimates ranging from $5 to $15. These are third-party analyst estimates, not Ticker Nerd forecasts, and they are frequently wrong.

Is NEOV stock a buy right now?

Of the 4 analysts covering NeoVolta, Inc., 3 rate it a Buy, 1 a Hold and 0 a Sell. Ticker Nerd's systematic factor model ranks NeoVolta, Inc. 37 out of 100 across roughly 4,600 US stocks as at 1 Aug 2026. None of this is personal advice — it does not consider your circumstances.

How does Ticker Nerd's model rank NEOV?

As at 1 Aug 2026, NeoVolta, Inc. ranks 37 out of 100 on Ticker Nerd's systematic factor model — a percentile across roughly 4,600 US stocks, built from its factor families. Its strongest factor family is Size (73 of 100).

Will NEOV stock go up?

No one can know that. What the data says: the median 12-month target from 4 analysts implies +284.6% from the last close, and Ticker Nerd's factor model ranks NeoVolta, Inc. 37 out of 100 as at 1 Aug 2026. Analyst targets are third-party estimates and frequently wrong; none of this is personal advice.

What is the NEOV stock forecast for 2030?

No analyst covering NeoVolta, Inc. publishes a 2030 price target — Wall Street targets run 12 to 18 months out. Sites quoting a 2030 price for NEOV are extrapolating price history, which says nothing about the business. The furthest attributed numbers are the current analyst targets: $5 to $15 over the next 12 months.

How has NEOV stock performed over the past year?

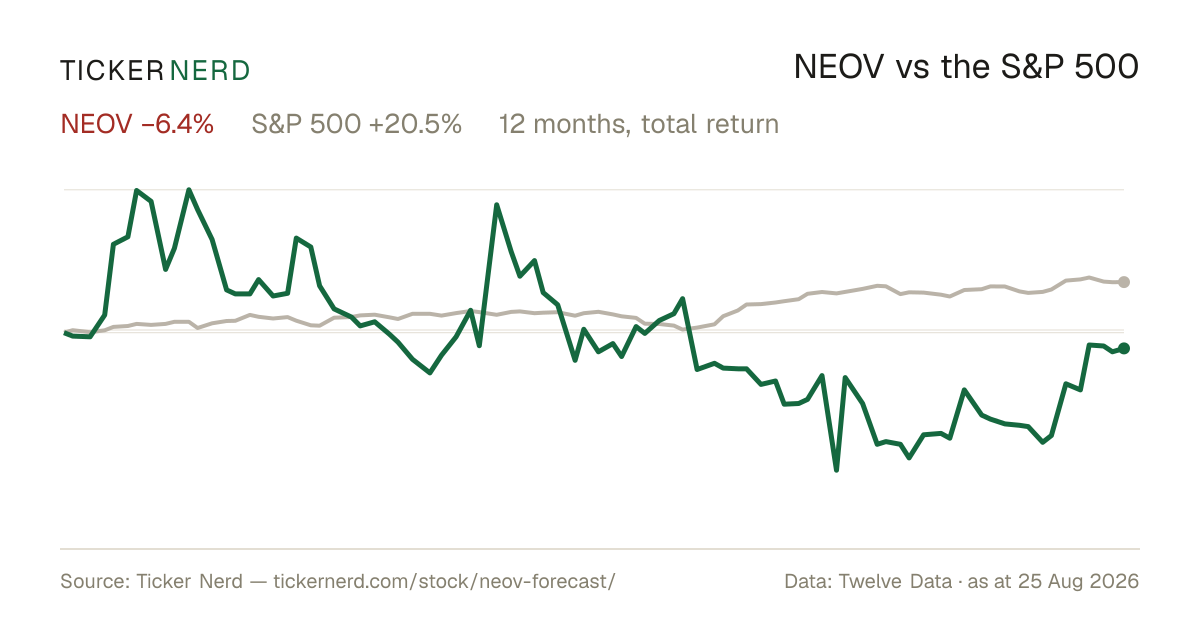
NeoVolta, Inc. returned -50.7% over the 12 months to 3 Aug 2026, with dividends reinvested. Past performance does not indicate future returns.

What does NeoVolta, Inc. do?

NeoVolta Inc. is an energy technology company that designs and manufactures residential energy storage systems for the solar market.

Company

About NeoVolta, Inc.

NeoVolta Inc. is an energy technology company that designs and manufactures residential energy storage systems for the solar market. Its systems integrate high-capacity batteries with inverters to store electricity generated from rooftop solar panels and provide backup power during grid interruptions, aiming to support continuous household energy use. NeoVolta’s product lineup, including models such as NV14, NV24, NVPlus, NV7600, and NV16, is configured for home installations and is typically paired with existing or new solar photovoltaic systems. The company serves solar installers, new homebuilders, home remodelers, and homeowners seeking to optimize on-site generation and improve power reliability. Operating within the industrials sector and the electrical equipment and parts industry, NeoVolta plays a role in the broader distributed energy and residential solar ecosystem. Founded in 2018 and headquartered in Poway, California, NeoVolta focuses on providing storage solutions that support the adoption and practical use of residential solar energy.

CEO Mr. Henry Ardes Johnson · 17 employees · United States · https://www.neovolta.com