NGSNGSEnergy · Oil & Gas Equipment & Services

NGS Stock Forecast: Natural Gas Services Group, Inc. Price Predictions for 2026-2027

Last close, 6 Aug 2026
$36
−0.76% on the day

The 3 Wall Street analysts covering Natural Gas Services Group, Inc. hold a median 12-month price target of $54 — +48.4% from the last close. Ticker Nerd's systematic factor model, run across ~4,600 US stocks, ranks it 58 of 100 as at 6 Aug 2026 — in the upper half.

Market cap
$472.3M
Ticker Nerd rank
58 / 100
Median analyst target
$54
Analysts covering
3
Total return, dividends reinvested
1W
+1.4%
1M
−2.9%
YTD
+8.9%
1Y
+51.5%
From 52W high
−17.5%
From 52W low
+53.4%
$24
$44
52-week range, adjusted closes · the dot is the last close
Ticker Nerd rank

NGS stock analysis: one number for the whole business

Consensus tells you what everyone already believes. The model scores Natural Gas Services Group, Inc. on its factor families — the same systematic rank behind the Ticker Nerd portfolio.

Where the model ranks itAs at 6 Aug 2026
58 / 100

Percentile across ~4,600 US stocks on Ticker Nerd’s systematic factor model. Higher is better. How the model is built and tested

Momentum
83
Volatility
73
Quality
72
Revisions
69
Size
55
Accruals
47
Growth
40
Value
30
Issuance
26

Momentum (83): The shares have been drifting up relative to others.

Issuance (26): The company has been issuing shares or taking on financing, diluting existing holders.

The rank is the raw material. Whether the rules would actually own Natural Gas Services Group, Inc. — and when they’d sell — is the membership.

Wall Street

NGS stock forecast 2026-2027: analyst price targets & predictions

The bullish and bearish analyst opinions on NGS, reported as data — targets and ratings, the market's view beside the model's.

Share price and the analyst range, 12 monthsAdjusted close, US dollars
$20$30$40$50$60Oct 25Jan 26Apr 26Jul 26NGSHigh $60Median $54Low $53

Price targets and ratings are third-party analyst estimates, reported here as data. They are not Ticker Nerd forecasts, and they are frequently wrong.

What Wall Street says3 analysts
3 Buy0 Hold0 Sell
Low $53Median $54High $60

The green dot is the last close — the median target sits +48.4% from it.

Recent analyst actionsNewest first
DateFirmActionRatingTarget
10 July 2026Raymond JamesMaintainsOutperform$53$54
13 May 2026StifelMaintainsBuy
20 Mar 2026StifelMaintainsBuy
13 Jan 2026Raymond JamesDowngradeOutperform
12 Nov 2025StifelMaintainsBuy
9 Sept 2025Texas Capital SecuritiesInitiatesBuy
16 May 2025StifelMaintainsBuy
19 Mar 2025Raymond JamesReiteratesStrong Buy
18 Mar 2025StifelReiteratesBuy
7 Aug 2024Raymond JamesInitiatesStrong Buy
3 Apr 2024StifelMaintainsBuy
20 Dec 2023StifelInitiatesBuy
17 May 2023Lake StreetMaintainsBuy
7 Aug 2019Imperial CapitalMaintainsOutperform
25 Jan 2019Maxim GroupInitiatesBuy
25 June 2018ArgusMaintainsBuy
25 June 2018Argus ResearchMaintainsBuy
24 May 2018ArgusMaintainsBuy
24 May 2018Argus ResearchMaintainsBuy
23 Aug 2017Imperial CapitalInitiatesOutperform

Price targets and ratings are third-party analyst estimates, reported here as data. They are not Ticker Nerd forecasts, and they are frequently wrong.

Estimates

NGS analyst estimate revisions

Not the forecast itself — the direction analysts are revising it. Revision direction is one of the model's factor families.

Which way the estimates are movingNext fiscal year
EPS revision, 90 days
+1.3%
Analysts raising
0
Analysts cutting
1
Fundamentals

Natural Gas Services Group, Inc. (NGS) financial data

A margin means little on its own. Each bar marks where the figure sits across the whole US universe we score.

Valuation
Trailing P/E
21.7×

Cheaper than 37% of US stocks

Price / sales
2.7×

Cheaper than 45% of US stocks

Price / book
1.6×

Cheaper than 53% of US stocks

EV / EBITDA
8.4×

Cheaper than 44% of US stocks

Growth & margins
Revenue growth (YoY)
17.1%

Higher than 68% of US stocks

Earnings growth (YoY)
39.3%

Higher than 73% of US stocks

Gross margin
41.1%

Higher than 53% of US stocks

Operating margin
27.7%

Higher than 87% of US stocks

Net margin
12.2%

Higher than 74% of US stocks

Returns & dividend
Return on equity
8.1%

Higher than 59% of US stocks

Return on assets
5.0%

Higher than 77% of US stocks

Dividend yield
1.6%

Higher than 38% of US dividend payers

Bars mark the percentile across the ~4,600 US stocks Ticker Nerd covers, among those reporting the figure.

Peers

NGS vs competitors

The nearest names by industry and size, scored by the same model — like for like.

Its peer group, ranked by the same modelOil & Gas Equipment & Services
CompanyMarket capTKN rank
NGSNatural Gas Services Group, Inc.$472.3M
58
OISOil States International, Inc.$500.3M
39
RNGRRanger Energy Services, Inc.$377.7M
60
ACDCProFrac Holding Corp.$807.6M
26
FETForum Energy Technologies, Inc.$856.0M
93
HMHHMH Holding, Inc.$858.9M
24
SNDSmart Sand, Inc.$190.0M
88
Market Radar

This page is one stock. Monday covers all of them.

Computed off the Friday close and sent before the US open.

Market Radar reports the week’s largest rank changes across roughly 4,600 US stocks, the factor behind each one, and where the market went. NGS appears on the weeks it earns a place.

Free, every Monday. Unsubscribe any time.

News

Latest NGS news & analysis

Analysts Estimate Natural Gas Services (NGS) to Report a Decline in Earnings: What to Look Out for

Zacks Investment Research · 3 Aug 2026negative

Zacks Investment Research reports that analysts estimate Natural Gas Services (NGS) will report a decline in earnings in its upcoming report. The article notes NGS lacks the right combination of two key ingredients likely needed for an earnings beat, advising investors on key expectations to watch.

Why it matters — An NGS watcher would care because the piece flags that the company's upcoming earnings are expected to decline rather than beat estimates, setting expectations for its next report.

Zacks Industry Outlook NOV, Oil States International and Natural Gas Services

Zacks Investment Research · 3 Aug 2026neutral

Zacks Investment Research published an Industry Outlook article highlighting NOV, Oil States International, and Natural Gas Services Group. Natural Gas Services Group is noted as one of the companies featured in the article.

Why it matters — The article brings NGS to the attention of investors tracking the oil-services industry, confirming its relevance among peers in the sector.

3 Oilfield Equipment Stocks That Can Thrive Amid Industry Headwinds

Zacks Investment Research · 31 July 2026negative

Zacks Investment Research published an article noting a gloomy outlook for the oil and gas mechanical and equipment industry, citing softer equipment demand and conservative upstream spending, while naming NGS among companies trying to survive these industry challenges.

Why it matters — NGS watchers would care because the article highlights ongoing headwinds in the oilfield equipment sector that could affect the company's operating environment.

FAQ

Frequently asked questions about NGS stock

What is the NGS stock price forecast for 2026-2027?

The 3 Wall Street analysts covering Natural Gas Services Group, Inc. have a median 12-month price target of $54, with estimates ranging from $53 to $60. These are third-party analyst estimates, not Ticker Nerd forecasts, and they are frequently wrong.

Is NGS stock a buy right now?

Of the 3 analysts covering Natural Gas Services Group, Inc., 3 rate it a Buy, 0 a Hold and 0 a Sell. Ticker Nerd's systematic factor model ranks Natural Gas Services Group, Inc. 58 out of 100 across roughly 4,600 US stocks as at 6 Aug 2026. None of this is personal advice — it does not consider your circumstances.

How does Ticker Nerd's model rank NGS?

As at 6 Aug 2026, Natural Gas Services Group, Inc. ranks 58 out of 100 on Ticker Nerd's systematic factor model — a percentile across roughly 4,600 US stocks, built from its factor families. Its strongest factor family is Momentum (83 of 100).

Will NGS stock go up?

No one can know that. What the data says: the median 12-month target from 3 analysts implies +48.4% from the last close, and Ticker Nerd's factor model ranks Natural Gas Services Group, Inc. 58 out of 100 as at 6 Aug 2026. Analyst targets are third-party estimates and frequently wrong; none of this is personal advice.

What is the NGS stock forecast for 2030?

No analyst covering Natural Gas Services Group, Inc. publishes a 2030 price target — Wall Street targets run 12 to 18 months out. Sites quoting a 2030 price for NGS are extrapolating price history, which says nothing about the business. The furthest attributed numbers are the current analyst targets: $53 to $60 over the next 12 months.

How has NGS stock performed over the past year?

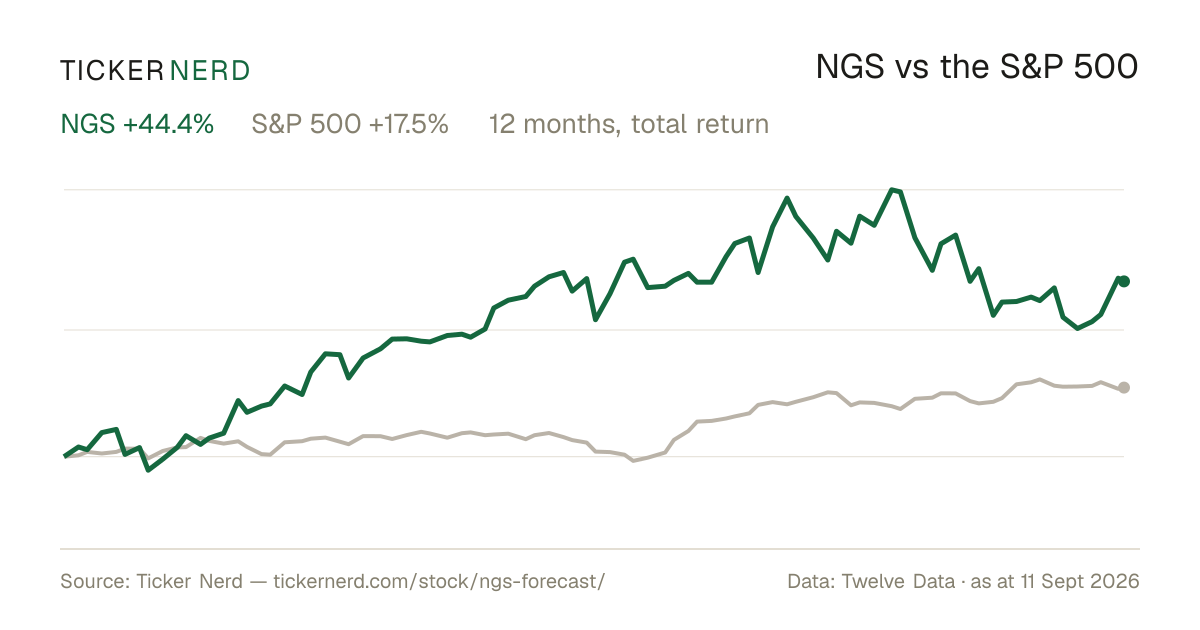
Natural Gas Services Group, Inc. returned +51.5% over the 12 months to 6 Aug 2026, with dividends reinvested. Past performance does not indicate future returns.

What does Natural Gas Services Group, Inc. do?

Natural Gas Services Group, Inc. is an energy sector company renowned for its provision of natural gas compression services and equipment.

What is the latest news on NGS?

The most recent item we track (Zacks Investment Research, 3 Aug 2026): "Analysts Estimate Natural Gas Services (NGS) to Report a Decline in Earnings: What to Look Out for". Zacks Investment Research reports that analysts estimate Natural Gas Services (NGS) will report a decline in earnings in its upcoming report. The article notes NGS lacks the right combination of two key ingredients likely needed for an earnings beat, advising investors on key expectations to watch.

Company

About Natural Gas Services Group, Inc.

Natural Gas Services Group, Inc. is an energy sector company renowned for its provision of natural gas compression services and equipment. It primary functions to design, manufacture, and service natural gas production equipment, ensuring the continual flow and extraction of natural gas from its source. This includes the rental and sale of small to medium horsepower compression equipment used by natural gas producers throughout the United States. The company plays a vital role in the natural gas industry by enhancing the efficiency and productivity of gas extraction, which is a critical component in meeting energy demand. Operating within key energy-producing regions, Natural Gas Services Group supports sectors such as utilities, chemical processing industries, and various industrial markets. Its services not only aid in effective resource extraction but also contribute to the optimization of operational costs for its clients. Founded in 1998 and based in Midland, Texas, this company remains integral to the infrastructural backbone of natural gas supply chains across major domestic markets, reinforcing its market significance in natural resource management and energy supply.

CEO Mr. Justin C. Jacobs · 259 employees · United States · https://www.ngsgi.com