NVDANVDATechnology · Semiconductors

NVDA Stock Forecast: NVIDIA Corp. Price Predictions for 2026-2027

Last close, 28 Sept 2026
$229
+1.68% on the day

The 61 Wall Street analysts covering NVIDIA Corp. hold a median 12-month price target of $315 — +37.6% from the last close. Ticker Nerd's systematic factor model, run across ~4,600 US stocks, ranks it 77 of 100 as at 28 Sept 2026 — inside the top quartile. Here, the model and the Street point the same way.

Market cap
$5.4T
Ticker Nerd rank
77 / 100
Median analyst target
$315
Analysts covering
61
Revenue$96.2B+105.9% y/y
Operating income$63.7B
Net income$59.7B
Free cash flow$21.4B
Quarterly, 8 quarters to 31 July 2026 · latest quarter's figure shown
Total return, dividends reinvested
1W
+0.7%
1M
+5.3%
YTD
+23.0%
1Y
+28.7%
From 52W high
−2.7%
From 52W low
+38.9%
$165
$235
52-week range, adjusted closes · the dot is the last close
Ticker Nerd rank

NVDA stock analysis: one number for the whole business

Consensus tells you what everyone already believes. The model scores NVIDIA Corp. on its factor families — the same systematic rank behind the Ticker Nerd portfolio.

Where the model ranks itAs at 28 Sept 2026
77 / 100

Percentile across ~4,600 US stocks on Ticker Nerd’s systematic factor model. Higher is better. How the model is built and tested

Quality
97
Revisions
96
Growth
80
Volatility
80
Momentum
76
Value
68
Issuance
43
Accruals
12
Size
0

Quality (97): The business earns solid, repeatable profits on what it owns.

Accruals (12): A large share of reported profit has not shown up as cash, or the balance sheet is expanding quickly — both tend to unwind.

Size (0): Larger than most of the companies we track — more scrutinised, less often mispriced.

Built and run by Aslam Ghouse, an ex-Goldman Sachs quant trader with fourteen years in markets.

The Ticker Nerd Read

Rank 75 of 100 as of 26 Sep 2026; Street's median $315 (28 Sep 2026).

As of 26 September 2026 our model ranks NVIDIA 75 of 100 across the stocks we track. Quality leads at 96.9: its 63.7% net margin and 117% return on equity rank above 97% of US stocks. Estimate revisions (95.5) and growth (80.0) add support.

Investment and accruals is the weak spot at 12.2: profit has not arrived as cash. Operating cash flow was $134.4 billion for the year to 31 July 2026, against $192.9 billion of net income. Inventory rose from $15.0 billion to $31.6 billion; size scores 0, and as of 28 September NVIDIA's $5.43 trillion market cap makes it the largest company the model tracks.

Shares last closed at $225.07 on 25 September 2026. As of 28 September the 61 analysts we track set a median target of $315, and 58 rate the shares buy or strong buy. The Street's target and the model's top factor lean on forecasts that keep rising.

The reading leans on revisions, and the Value family's forward earnings yield of 80.4 depends on the same high estimates. Next-year EPS consensus is $15.68 as of 22 September 2026, up 23.7% in 90 days; last month 42 analysts raised and none cut. NVIDIA's next report, covering the three months to 31 October 2026, checks the forecasts and the cash gap behind the accruals reading.

As of 28 Sept 2026
Wall Street

NVDA stock forecast 2026-2027: analyst price targets & predictions

The bullish and bearish analyst opinions on NVDA, reported as data — targets and ratings, the market's view beside the model's.

Share price and the analyst range, 12 monthsAdjusted close, US dollars
$100$200$300$400$500Oct 25Jan 26Apr 26Jul 26NVDAHigh $515Median $315Low $180

Price targets and ratings are third-party analyst estimates, reported here as data. They are not Ticker Nerd forecasts, and they are frequently wrong.

Data provided by Twelve Data

What Wall Street says61 analysts
58 Buy2 Hold1 Sell
Low $180Median $315High $515

The green dot is the last close — the median target sits +37.6% from it.

Recent analyst actionsNewest first

Of the 20 most recent actions, 5 moved their price target up and 0 moved it down.

DateFirmActionRatingTarget
10 Sept 2026Piper SandlerInitiatesOverweight$300
4 Sept 2026NeedhamReiteratesBuy$300
4 Sept 2026RosenblattMaintainsBuy$390
27 Aug 2026BenchmarkReiteratesBuy—
27 Aug 2026BenchmarkReiteratesBuy$335
27 Aug 2026BernsteinMaintainsOutperform$315 → $400
27 Aug 2026BernsteinMaintainsOutperform—
27 Aug 2026Cantor FitzgeraldReiteratesOverweight—
27 Aug 2026Cantor FitzgeraldReiteratesOverweight$350
27 Aug 2026CitigroupMaintainsBuy$300 → $315
27 Aug 2026CitigroupMaintainsBuy—
27 Aug 2026DA DavidsonMaintainsBuy$300
27 Aug 2026DA DavidsonMaintainsBuy—
27 Aug 2026Evercore ISI GroupMaintainsOutperform—
27 Aug 2026Evercore ISI GroupMaintainsOutperform$413 → $465
27 Aug 2026JP MorganMaintainsOverweight$280 → $320
27 Aug 2026JP MorganMaintainsOverweight—
27 Aug 2026KeybancReiteratesOverweight—
27 Aug 2026KeybancReiteratesOverweight$330
27 Aug 2026MizuhoMaintainsOutperform$300 → $315

Price targets and ratings are third-party analyst estimates, reported here as data. They are not Ticker Nerd forecasts, and they are frequently wrong.

Market Radar

This page is one stock. Monday covers all of them.

Computed off the Friday close and sent before the US open.

Market Radar reports the week’s largest rank changes across roughly 4,600 US stocks, the factor behind each one, and where the market went. NVDA appears on the weeks it earns a place.

Free, every Monday. Unsubscribe any time.

Performance

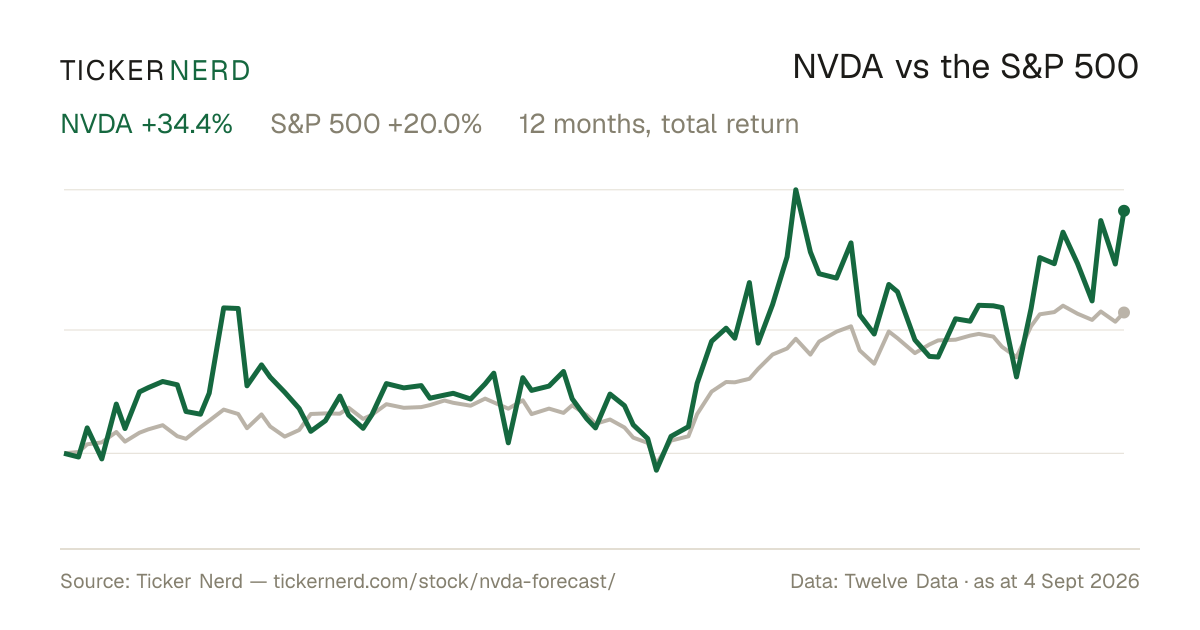
NVDA vs the S&P 500

Both lines are total return — dividends reinvested — so the comparison is honest on both sides.

Over the twelve months to 28 Sept 2026, NVIDIA Corp. returned +28.7% against +16.9% for the S&P 500, dividends included.

NVDA vs S&P 500, last 12 monthsTotal return, rebased to 100
90100110120130Oct 25Jan 26Apr 26Jul 26NVDAS&P 500

Download this chart as an image — free to reuse; link this page as the source.

Data provided by Twelve Data

Estimates

NVDA analyst estimate revisions

Not the forecast itself — the direction analysts are revising it. Revision direction is one of the model's factor families.

Which way the estimates are movingNext fiscal year
EPS revision, 90 days
+4.3%
Analysts raising
39
Analysts cutting
1
Fundamentals

NVIDIA Corp. (NVDA) financial data

A margin means little on its own. Each bar marks where the figure sits across the whole US universe we score.

Valuation
Trailing P/E
28.5×

Cheaper than 27% of US stocks

Price / sales
17.9×

Cheaper than 10% of US stocks

Price / book
23.7×

Cheaper than 4% of US stocks

EV / EBITDA
26.8×

Cheaper than 10% of US stocks

Growth & margins
Revenue growth (YoY)
105.9%

Higher than 93% of US stocks

Earnings growth (YoY)
125.9%

Higher than 86% of US stocks

Gross margin
75.0%

Higher than 87% of US stocks

Operating margin
66.2%

Higher than 99% of US stocks

Net margin
63.7%

Higher than 97% of US stocks

Returns & dividend
Return on equity
117.2%

Higher than 97% of US stocks

Return on assets
53.6%

Higher than 99% of US stocks

Dividend yield
0.4%

Higher than 8% of US dividend payers

Bars mark the percentile across the ~4,600 US stocks Ticker Nerd covers, among those reporting the figure.

Key statistics

NVIDIA Corp. (NVDA) statistics: revenue, profit & scale

The headline figures, each with its date. Every row carries its own link — cite it straight from here.

  • NVIDIA Corp. has a market value of $5.4T and an enterprise value of $5.4T.

  • Revenue in the twelve months to 31 July 2026: $303.0B. The latest quarter grew 105.9% year on year.

  • Net income over the same four quarters: $192.9B, a 63.7% net margin.

  • Diluted earnings per share, trailing twelve months: $7.91.

  • Free cash flow in the twelve months to 31 July 2026: $127.0B.

  • NVIDIA Corp. spent $55.3B on share buybacks and $6.8B on dividends in the twelve months to 31 July 2026.

  • Shares outstanding: 24.1B.

  • Trailing P/E: 28.5×; forward P/E: 14.4× — the forward figure prices analyst consensus estimates, not reported earnings.

  • Forward dividend yield: 0.44%, paying out 4% of earnings.

  • NVIDIA Corp. employs 42,000 people — $7.2M of revenue per employee.

Statement figures: company filings via Twelve Data, four quarters to 31 July 2026 · market figures as at 28 Sept 2026

Data provided by Twelve Data

Peers

NVDA vs competitors

The nearest names by industry and size, scored by the same model — like for like.

Its peer group, ranked by the same modelSemiconductors
CompanyMarket capTKN rank
NVDANVIDIA Corp.$5.4T
77
AVGOBroadcom Inc.$1.7T
73
MUMicron Technology, Inc.$1.2T
90
AMDAdvanced Micro Devices, Inc.$991.1B
66
INTCIntel Corp.$613.3B
71
TXNTexas Instruments Incorporated$252.9B
89
AAPLApple, Inc.*$4.9T
82

* Nearest Technology names by size — few semiconductors companies of this scale trade in the US universe.

Look up any of the roughly 4,600 stocks we score.

The rank is the raw material. Whether the rules would actually own NVIDIA Corp. — and when they’d sell — is the membership. See the Ticker Nerd 20 →

News

Latest NVDA news & analysis

Not Broadcom. Not AMD. Nvidia's Biggest Threat Continues to Be Something Near and Dear to Its Heart.

The Motley Fool · 29 Sept 2026positive

The article examines Nvidia's competitive position against rivals Broadcom and AMD, concluding that neither poses a serious threat to its GPU compute dominance despite AMD's potential to slowly erode its market share. The piece instead suggests Nvidia's biggest challenge comes from a source closer to home.

Why it matters — A NVDA watcher would care because the article argues that Nvidia's main competitive threats and biggest risk differ from the widely watched AMD and Broadcom rivalries.

Nvidia's robotics lab is becoming a founder factory

Business Insider · 29 Sept 2026positive

Business Insider reports that Nvidia's robotics lab is increasingly serving as a launching pad for founders, with alumni of the lab striking out to start their own companies. The trend is being fueled by advances in AI and a surge of venture capital funding.

Why it matters — A growing number of startups founded by Nvidia robotics alumni could extend Nvidia's influence across the AI-robotics ecosystem and highlight the company's role as a talent and technology incubator.

Nvidia's Next Win May Be Better Than Stock Buybacks

Barrons · 29 Sept 2026positive

Barron's reports that Nvidia is riding a wave of wins, and the stock's short-term technical outlook appears strong, with shares positioned to make new record highs. The article suggests Nvidia's next potential win may be more significant than stock buybacks.

Why it matters — An NVDA watcher would care because the article highlights strengthening technical momentum and the prospect of new record highs, suggesting continued positive momentum for the chip maker.

Not the GPUs. This Overlooked Piece of Nvidia's Business Could Matter Most for the Stock's Next Leg Up.

The Motley Fool · 29 Sept 2026positive

The article highlights that while Nvidia's triple-digit revenue growth has been driven by its dominance in the GPU market, the company is also seeking market leadership in another area considered key to AI. This other business segment is framed as potentially the most important factor for Nvidia's next growth phase.

Why it matters — NVDA watchers would care because a second, overlooked business line could become a major growth driver beyond GPUs and underpin the stock's next leg up.

CNBC Daily Open: AI's creators sound the alarm — while others keep building the infrastructure

CNBC · 29 Sept 2026neutral

Nvidia has launched a platform that enables AI developers to prevent AI from breaking out of containment. Separately, Anthropic reportedly stated in its prospectus that advanced AI could pose catastrophic or existential risks to humanity.

Why it matters — The new platform expands Nvidia's AI development offerings, potentially reinforcing its role in AI safety infrastructure as industry concerns about advanced AI risks grow.

FAQ

Frequently asked questions about NVDA stock

What is the NVDA stock price forecast for 2026-2027?

The 61 Wall Street analysts covering NVIDIA Corp. have a median 12-month price target of $315, with estimates ranging from $180 to $515. These are third-party analyst estimates, not Ticker Nerd forecasts, and they are frequently wrong.

Is NVDA stock a buy right now?

Of the 61 analysts covering NVIDIA Corp., 58 rate it a Buy, 2 a Hold and 1 a Sell. Ticker Nerd's systematic factor model ranks NVIDIA Corp. 77 out of 100 across roughly 4,600 US stocks as at 28 Sept 2026. None of this is personal advice — it does not consider your circumstances.

How does Ticker Nerd's model rank NVDA?

As at 28 Sept 2026, NVIDIA Corp. ranks 77 out of 100 on Ticker Nerd's systematic factor model — a percentile across roughly 4,600 US stocks, built from its factor families. Its strongest factor family is Quality (97 of 100).

Will NVDA stock go up?

No one can know that. What the data says: the median 12-month target from 61 analysts implies +37.6% from the last close, and Ticker Nerd's factor model ranks NVIDIA Corp. 77 out of 100 as at 28 Sept 2026. Analyst targets are third-party estimates and frequently wrong; none of this is personal advice.

What is the NVDA stock forecast for 2030?

No analyst covering NVIDIA Corp. publishes a 2030 price target — Wall Street targets run 12 to 18 months out. Sites quoting a 2030 price for NVDA are extrapolating price history, which says nothing about the business. The furthest attributed numbers are the current analyst targets: $180 to $515 over the next 12 months.

How has NVDA stock performed over the past year?

NVIDIA Corp. returned +28.7% over the 12 months to 28 Sept 2026, with dividends reinvested. Past performance does not indicate future returns.

What does NVIDIA Corp. do?

NVIDIA designs graphics processors, data-center systems, networking hardware, and the software behind AI training and inference, high-performance computing, gaming, and robotics. Its customers are cloud providers, enterprises, researchers, and consumers, with sales split between its Compute & Networking and Graphics segments.

What is the latest news on NVDA?

The most recent item we track (The Motley Fool, 29 Sept 2026): "Not Broadcom. Not AMD. Nvidia's Biggest Threat Continues to Be Something Near and Dear to Its Heart.". The article examines Nvidia's competitive position against rivals Broadcom and AMD, concluding that neither poses a serious threat to its GPU compute dominance despite AMD's potential to slowly erode its market share. The piece instead suggests Nvidia's biggest challenge comes from a source closer to home.

Why is the forward P/E far below the trailing P/E?

As of 28 September 2026, NVIDIA's trailing P/E was 28.5 and its forward P/E 14.4. The forward multiple prices in next-year consensus EPS of $15.68 as of 22 September 2026. Analysts raised that estimate 23.7% over 90 days, and the trailing multiple uses the past four quarters of reported earnings.

Company

About NVIDIA Corp.

NVIDIA designs graphics processors, data-center systems, networking hardware, and the software behind AI training and inference, high-performance computing, gaming, and robotics. Its customers are cloud providers, enterprises, researchers, and consumers, with sales split between its Compute & Networking and Graphics segments. As of 28 September 2026 it had a market value of $5.43 trillion, revenue of $303 billion across the past four reported quarters, and 42,000 employees.

CEO Mr. Jen-Hsun Huang · 42,000 employees · United States · https://www.nvidia.com