NWLNWLConsumer Defensive · Household & Personal Products

NWL Stock Forecast: Newell Brands, Inc. Price Predictions for 2026-2027

Last close, 2 Oct 2026
$5.41
+1.88% on the day

The 9 Wall Street analysts covering Newell Brands, Inc. hold a median 12-month price target of $6 — +10.9% from the last close. Ticker Nerd's systematic factor model, run across ~4,600 US stocks, ranks it 68 of 100 as at 2 Oct 2026 — in the upper half.

Market cap
$2.3B
Ticker Nerd rank
68 / 100
Median analyst target
$6.00
Analysts covering
9
Revenue$2.0B+3.0% y/y
Operating income$293.0M
Net income$106.0M
Free cash flow−$18.0M
Quarterly, 8 quarters to 30 June 2026 · latest quarter's figure shown
Total return, dividends reinvested
1W
−0.4%
1M
−9.5%
YTD
+51.5%
1Y
+10.4%
From 52W high
−14.7%
From 52W low
+84.9%
$2.93
$6.34
52-week range, adjusted closes · the dot is the last close
Ticker Nerd rank

NWL stock analysis: one number for the whole business

Consensus tells you what everyone already believes. The model scores Newell Brands, Inc. on its factor families — the same systematic rank behind the Ticker Nerd portfolio.

Where the model ranks itAs at 2 Oct 2026
68 / 100

Percentile across ~4,600 US stocks on Ticker Nerd’s systematic factor model. Higher is better. How the model is built and tested

Revisions
84
Accruals
83
Growth
72
Issuance
71
Value
54
Momentum
47
Size
34
Quality
33
Volatility
13

Revisions (84): Analysts have, on balance, been raising their forecasts.

Volatility (13): The share price moves around a lot.

Built and run by Aslam Ghouse, an ex-Goldman Sachs quant trader with fourteen years in markets.

Wall Street

NWL stock forecast 2026-2027: analyst price targets & predictions

The bullish and bearish analyst opinions on NWL, reported as data — targets and ratings, the market's view beside the model's.

Share price and the analyst range, 12 monthsAdjusted close, US dollars
$2.00$4.00$6.00$8.00$10.00$12.00Jan 26Apr 26Jul 26Oct 26NWLHigh $11.00Median $6.00Low $5.00

Price targets and ratings are third-party analyst estimates, reported here as data. They are not Ticker Nerd forecasts, and they are frequently wrong.

Data provided by Twelve Data

What Wall Street says9 analysts
3 Buy5 Hold1 Sell
Low $5.00Median $6.00High $11.00

The green dot is the last close — the median target sits +10.9% from it.

Recent analyst actionsNewest first

Of the 20 most recent actions, 7 moved their price target up and 1 moved it down.

DateFirmActionRatingTarget
4 Aug 2026CitigroupMaintainsNeutral$5.50 → $6.00
3 Aug 2026Canaccord GenuityMaintainsBuy$9.00 → $11
3 Aug 2026RBC CapitalMaintainsSector Perform$4.00 → $5.00
3 Aug 2026UBSMaintainsNeutral$4.75 → $5.50
21 July 2026BarclaysMaintainsOverweight—
21 July 2026BarclaysMaintainsOverweight$5.00 → $7.00
16 July 2026JP MorganMaintainsOverweight$5.00 → $7.00
16 July 2026JP MorganMaintainsOverweight—
16 July 2026UBSMaintainsNeutral$4.25 → $4.75
16 July 2026UBSMaintainsNeutral—
20 May 2026Morgan StanleyDowngradeUnderweight$4.00 → $3.50
20 May 2026Morgan StanleyDowngradeUnderweight—
4 May 2026CitigroupMaintainsNeutral—
4 May 2026UBSMaintainsNeutral—
16 Apr 2026Canaccord GenuityMaintainsBuy—
15 Apr 2026CitigroupMaintainsNeutral—
14 Apr 2026BarclaysMaintainsOverweight—
7 Apr 2026UBSMaintainsNeutral—
30 Mar 2026Deutsche BankMaintainsHold—
10 Feb 2026Morgan StanleyMaintainsEqual-Weight—

Price targets and ratings are third-party analyst estimates, reported here as data. They are not Ticker Nerd forecasts, and they are frequently wrong.

Market Radar

This page is one stock. Monday covers all of them.

Computed off the Friday close and sent before the US open.

Market Radar reports the week’s largest rank changes across roughly 4,600 US stocks, the factor behind each one, and where the market went. NWL appears on the weeks it earns a place.

Free, every Monday. Unsubscribe any time.

Performance

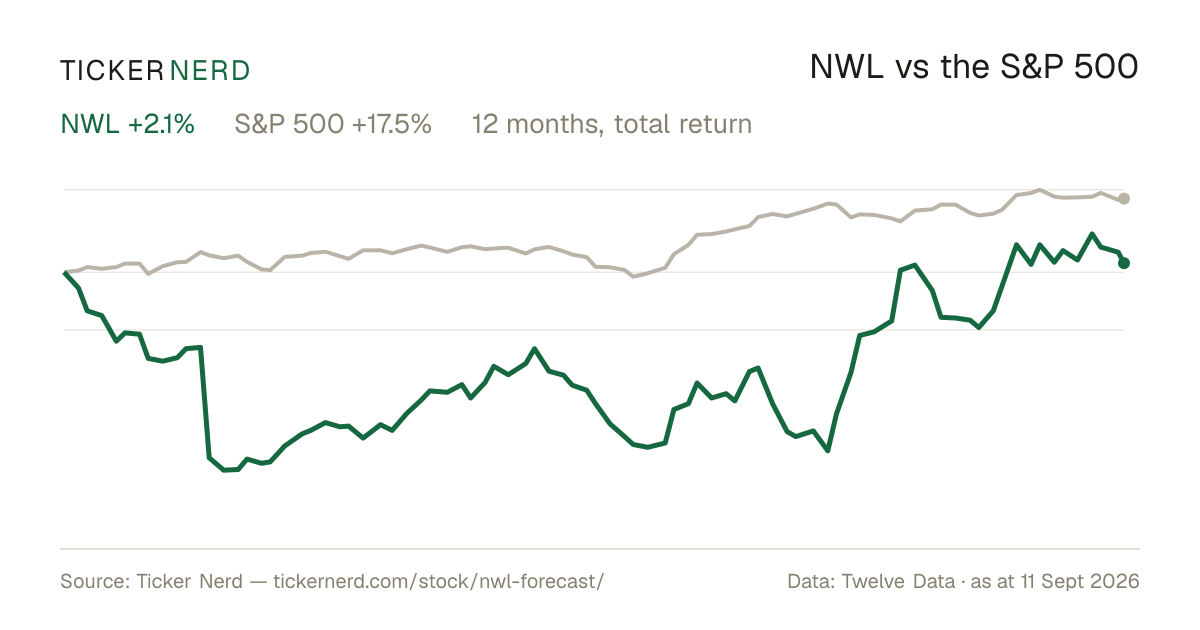
NWL vs the S&P 500

Both lines are total return — dividends reinvested — so the comparison is honest on both sides.

Over the twelve months to 2 Oct 2026, Newell Brands, Inc. returned +10.4% against +16.2% for the S&P 500, dividends included.

NWL vs S&P 500, last 12 monthsTotal return, rebased to 100
6080100120Jan 26Apr 26Jul 26Oct 26NWLS&P 500

Download this chart as an image — free to reuse; link this page as the source.

Data provided by Twelve Data

Estimates

NWL analyst estimate revisions

Not the forecast itself — the direction analysts are revising it. Revision direction is one of the model's factor families.

Which way the estimates are movingNext fiscal year
EPS revision, 90 days
+32.0%
Analysts raising
9
Analysts cutting
0
Fundamentals

Newell Brands, Inc. (NWL) financial data

A margin means little on its own. Each bar marks where the figure sits across the whole US universe we score.

Valuation
Trailing P/E
−8.0×

Cheaper than 92% of US stocks

Price / sales
0.3×

Cheaper than 88% of US stocks

Price / book
0.9×

Cheaper than 74% of US stocks

EV / EBITDA
8.6×

Cheaper than 42% of US stocks

Growth & margins
Revenue growth (YoY)
3.0%

Higher than 34% of US stocks

Earnings growth (YoY)
130.4%

Higher than 87% of US stocks

Gross margin
40.7%

Higher than 51% of US stocks

Operating margin
14.7%

Higher than 72% of US stocks

Net margin
−3.0%

Higher than 26% of US stocks

Returns & dividend
Return on equity
−8.6%

Higher than 37% of US stocks

Return on assets
3.3%

Higher than 67% of US stocks

Dividend yield
5.2%

Higher than 82% of US dividend payers

Bars mark the percentile across the ~4,600 US stocks Ticker Nerd covers, among those reporting the figure.

Key statistics

Newell Brands, Inc. (NWL) statistics: revenue, profit & scale

The headline figures, each with its date. Every row carries its own link — cite it straight from here.

  • Newell Brands, Inc. has a market value of $2.3B and an enterprise value of $7.8B.

  • Revenue in the twelve months to 30 June 2026: $7.2B. The latest quarter grew 3.0% year on year.

  • Net income over the same four quarters: −$221.0M, a −3.0% net margin.

  • Diluted earnings per share, trailing twelve months: $−0.53.

  • Free cash flow in the twelve months to 30 June 2026: $118.0M, after $213.0M of capital spending.

  • Newell Brands, Inc. spent $126.0M on dividends in the twelve months to 30 June 2026.

  • Shares outstanding: 425.4M.

  • Trailing P/E: −8.0×; forward P/E: 7.9× — the forward figure prices analyst consensus estimates, not reported earnings.

  • Forward dividend yield: 5.18%, paying out 196% of earnings.

  • Newell Brands, Inc. employs 21,900 people — $331K of revenue per employee.

Statement figures: company filings via Twelve Data, four quarters to 30 June 2026 · market figures as at 3 Oct 2026

Data provided by Twelve Data

Peers

NWL vs competitors

The nearest names by industry and size, scored by the same model — like for like.

Its peer group, ranked by the same modelHousehold & Personal Products
CompanyMarket capTKN rank
NWLNewell Brands, Inc.$2.3B
68
COTYCoty, Inc.$2.3B
55
SPBSpectrum Brands Holdings, Inc.$1.8B
99
IPARInterparfums, Inc.$3.7B
83
EPCEdgewell Personal Care Co.$1.3B
78
ODDODDITY Tech Ltd.$871.8M
14
ELFe.l.f. Beauty, Inc.$6.2B
39

Look up any of the roughly 4,600 stocks we score.

The rank is the raw material. Whether the rules would actually own Newell Brands, Inc. — and when they’d sell — is the membership. See the Ticker Nerd 20 →

News

Latest NWL news & analysis

Newell Brands to Webcast Third Quarter 2026 Earnings Results

Business Wire · 2 Oct 2026neutral

Newell Brands announced it will release its third quarter 2026 earnings results on Friday, October 30, 2026, prior to market open, followed by a live webcast at 7:30 a.m. ET. The webcast will be available on the company's Investors page and recorded for replay.

Why it matters — A Newell Brands watcher would want to know the date and time of the upcoming earnings release and webcast so they can tune in for the company's third quarter financial results.

Oster Takes on Blending's Biggest Frustrations - Noise, Performance and Materials - With Three New Innovations

PRNewsWire · 1 Oct 2026positive

Oster launched its new Vortex Blender Series, featuring vortex blending, reversible motor technology, and intelligent iBlend auto programs, as the latest addition to its 2026 blender innovation portfolio. This follows the recent QuietPro and Titan blender launches, each designed to address distinct consumer needs around performance, noise, and materials.

Why it matters — For NWL watchers, ongoing blender innovation and portfolio expansion under the Oster brand reflect the company's efforts to address everyday consumer frustrations and strengthen its product lineup.

Newell Brands Is In The Earliest Stages Of A Turnaround (Ratings Upgrade)

Seeking Alpha · 29 Sept 2026positive

Seeking Alpha notes Newell Brands is in the earliest stages of a turnaround, citing cost-cutting, operational streamlining, and modest revenue growth after years of decline. The author upgraded the stock to a soft and speculative 'buy,' viewing shares as deeply undervalued despite ongoing risks.

Why it matters — NWL watchers would care because early improvements in profitability metrics from SKU rationalization, supply chain integration, and workforce reductions suggest the company's restructuring efforts may be starting to gain traction.

6 High-Yield Dividends at Risk of a Cut After Asset Sales Dry Up

24/7 Wall Street · 29 Sept 2026negative

The article highlights companies that may be at risk of cutting high-yield dividends once their asset sales, which have been sustaining payouts, dry up. Newell Brands is among those flagged, as selling assets can only support a dividend temporarily while shrinking the remaining asset pool.

Why it matters — A NWL watcher would care because the article warns that the company's dividend could face pressure if asset sales cease, potentially signaling financial strain for shareholders.

Why Newell Brands (NWL) is a Top Value Stock for the Long-Term

Zacks Investment Research · 23 Sept 2026positive

Zacks Investment Research highlighted Newell Brands (NWL) as a top value stock for the long term, referencing its Zacks Style Scores feature, a component of the Zacks Premium research service, as a way to identify strong stocks.

Why it matters — A NWL watcher would care because this recognition positions the company favorably among value-focused investors based on Zacks' stock-selection methodology.

FAQ

Frequently asked questions about NWL stock

What is the NWL stock price forecast for 2026-2027?

The 9 Wall Street analysts covering Newell Brands, Inc. have a median 12-month price target of $6, with estimates ranging from $5 to $11. These are third-party analyst estimates, not Ticker Nerd forecasts, and they are frequently wrong.

Is NWL stock a buy right now?

Of the 9 analysts covering Newell Brands, Inc., 3 rate it a Buy, 5 a Hold and 1 a Sell. Ticker Nerd's systematic factor model ranks Newell Brands, Inc. 68 out of 100 across roughly 4,600 US stocks as at 2 Oct 2026. None of this is personal advice — it does not consider your circumstances.

How does Ticker Nerd's model rank NWL?

As at 2 Oct 2026, Newell Brands, Inc. ranks 68 out of 100 on Ticker Nerd's systematic factor model — a percentile across roughly 4,600 US stocks, built from its factor families. Its strongest factor family is Revisions (84 of 100).

Will NWL stock go up?

No one can know that. What the data says: the median 12-month target from 9 analysts implies +10.9% from the last close, and Ticker Nerd's factor model ranks Newell Brands, Inc. 68 out of 100 as at 2 Oct 2026. Analyst targets are third-party estimates and frequently wrong; none of this is personal advice.

What is the NWL stock forecast for 2030?

No analyst covering Newell Brands, Inc. publishes a 2030 price target — Wall Street targets run 12 to 18 months out. Sites quoting a 2030 price for NWL are extrapolating price history, which says nothing about the business. The furthest attributed numbers are the current analyst targets: $5 to $11 over the next 12 months.

How has NWL stock performed over the past year?

Newell Brands, Inc. returned +10.4% over the 12 months to 2 Oct 2026, with dividends reinvested. Past performance does not indicate future returns.

What does Newell Brands, Inc. do?

Newell Brands Inc. is a global consumer goods company that designs, manufactures, and distributes a broad portfolio of household, commercial, and specialty products.

What is the latest news on NWL?

The most recent item we track (Business Wire, 2 Oct 2026): "Newell Brands to Webcast Third Quarter 2026 Earnings Results". Newell Brands announced it will release its third quarter 2026 earnings results on Friday, October 30, 2026, prior to market open, followed by a live webcast at 7:30 a.m. ET. The webcast will be available on the company's Investors page and recorded for replay.

Company

About Newell Brands, Inc.

Newell Brands Inc. is a global consumer goods company that designs, manufactures, and distributes a broad portfolio of household, commercial, and specialty products. The Newell Brands name is associated with well-known brands such as Sharpie, Paper Mate, Rubbermaid, Graco, Coleman, Yankee Candle, FoodSaver, Dymo, EXPO, Elmer’s, Oster, and NUK, which serve everyday needs across writing, home organization, food storage, baby care, outdoor recreation, and home appliances. The company operates through three main segments: Home and Commercial Solutions, Learning and Development, and Outdoor and Recreation. Its products are sold through retail stores, e-commerce channels, distributors, and other commercial networks in markets across North America, Europe, Latin America, Asia-Pacific, and other regions. Headquartered in Atlanta, Georgia, Newell Brands plays a significant role in the branded consumer products market through its diverse mix of widely recognized household names.

CEO Mr. Christopher H. Peterson · 21,900 employees · United States · https://www.newellbrands.com