PEPPEPConsumer Defensive · Beverages - Non-Alcoholic

PEP Stock Forecast: PepsiCo, Inc. Price Predictions for 2026-2027

Last close, 4 Sept 2026
$138
−0.63% on the day

The 24 Wall Street analysts covering PepsiCo, Inc. hold a median 12-month price target of $155 — +12.6% from the last close. Ticker Nerd's systematic factor model, run across ~4,600 US stocks, ranks it 63 of 100 as at 5 Sept 2026 — in the upper half.

Market cap
$188.0B
Ticker Nerd rank
63 / 100
Median analyst target
$155
Analysts covering
24
Revenue$24.2B+6.4% y/y
Operating income$4.0B
Net income$3.0B
Free cash flow$1.5B
Quarterly, 8 quarters to 30 June 2026 · latest quarter's figure shown
Total return, dividends reinvested
1W
−1.4%
1M
+0.0%
YTD
−1.3%
1Y
−1.7%
From 52W high
−16.9%
From 52W low
+3.4%
$133
$166
52-week range, adjusted closes · the dot is the last close
Ticker Nerd rank

PEP stock analysis: one number for the whole business

Consensus tells you what everyone already believes. The model scores PepsiCo, Inc. on its factor families — the same systematic rank behind the Ticker Nerd portfolio.

Where the model ranks itAs at 5 Sept 2026
63 / 100

Percentile across ~4,600 US stocks on Ticker Nerd’s systematic factor model. Higher is better. How the model is built and tested

Volatility
94
Quality
82
Growth
77
Value
63
Revisions
62
Issuance
55
Momentum
53
Accruals
41
Size
1

Volatility (94): The share price has been relatively steady.

Accruals (41): A large share of reported profit has not shown up as cash, or the balance sheet is expanding quickly — both tend to unwind.

Size (1): Larger than most of the companies we track — more scrutinised, less often mispriced.

Built and run by Aslam Ghouse, an ex-Goldman Sachs quant trader with fourteen years in markets.

Wall Street

PEP stock forecast 2026-2027: analyst price targets & predictions

The bullish and bearish analyst opinions on PEP, reported as data — targets and ratings, the market's view beside the model's.

Share price and the analyst range, 12 monthsAdjusted close, US dollars
$120$130$140$150$160$170$180$190Oct 25Jan 26Apr 26Jul 26PEPHigh $183Median $155Low $124

Price targets and ratings are third-party analyst estimates, reported here as data. They are not Ticker Nerd forecasts, and they are frequently wrong.

Data provided by Twelve Data

What Wall Street says24 analysts
7 Buy16 Hold1 Sell
Low $124Median $155High $183

The green dot is the last close — the median target sits +12.6% from it.

Recent analyst actionsNewest first

Of the 20 most recent actions, 1 moved their price target up and 8 moved it down.

DateFirmActionRatingTarget
21 July 2026BarclaysMaintainsEqual-Weight
21 July 2026BarclaysMaintainsEqual-Weight$138$142
10 July 2026BarclaysMaintainsEqual-Weight
10 July 2026BarclaysMaintainsEqual-Weight$144$138
10 July 2026CitigroupDowngradeNeutral$170$145
10 July 2026CitigroupDowngradeNeutral
10 July 2026JefferiesMaintainsHold
10 July 2026JefferiesMaintainsHold$162$152
10 July 2026Morgan StanleyMaintainsEqual-Weight$180$160
10 July 2026Morgan StanleyMaintainsEqual-Weight
10 July 2026RBC CapitalMaintainsSector Perform$163$161
10 July 2026RBC CapitalMaintainsSector Perform
10 July 2026TD CowenMaintainsHold$150$145
10 July 2026TD CowenMaintainsHold
10 July 2026Wells FargoMaintainsEqual-Weight$150$140
10 July 2026Wells FargoMaintainsEqual-Weight
8 July 2026BNP ParibasMaintainsOutperform$195$183
8 July 2026BNP ParibasMaintainsOutperform
2 July 2026BarclaysMaintainsEqual-Weight
2 July 2026UBSMaintainsBuy

Price targets and ratings are third-party analyst estimates, reported here as data. They are not Ticker Nerd forecasts, and they are frequently wrong.

Market Radar

This page is one stock. Monday covers all of them.

Computed off the Friday close and sent before the US open.

Market Radar reports the week’s largest rank changes across roughly 4,600 US stocks, the factor behind each one, and where the market went. PEP appears on the weeks it earns a place.

Free, every Monday. Unsubscribe any time.

Performance

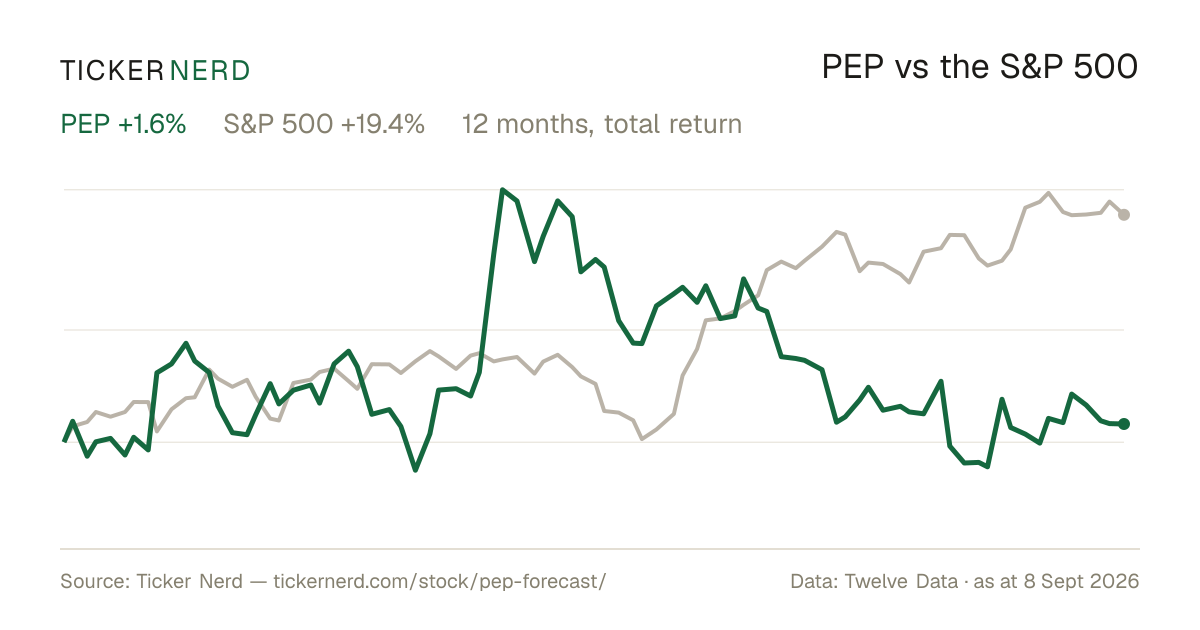
PEP vs the S&P 500

Both lines are total return — dividends reinvested — so the comparison is honest on both sides.

Over the twelve months to 4 Sept 2026, PepsiCo, Inc. returned −1.7% against +20.0% for the S&P 500, dividends included.

PEP vs S&P 500, last 12 monthsTotal return, rebased to 100
95100105110115120Oct 25Jan 26Apr 26Jul 26PEPS&P 500

Download this chart as an image — free to reuse; link this page as the source.

Data provided by Twelve Data

Estimates

PEP analyst estimate revisions

Not the forecast itself — the direction analysts are revising it. Revision direction is one of the model's factor families.

Which way the estimates are movingNext fiscal year
EPS revision, 90 days
−1.2%
Analysts raising
1
Analysts cutting
18
Fundamentals

PepsiCo, Inc. (PEP) financial data

A margin means little on its own. Each bar marks where the figure sits across the whole US universe we score.

Valuation
Trailing P/E
18.1×

Cheaper than 41% of US stocks

Price / sales
1.9×

Cheaper than 54% of US stocks

Price / book
8.5×

Cheaper than 12% of US stocks

EV / EBITDA
12.2×

Cheaper than 31% of US stocks

Growth & margins
Revenue growth (YoY)
6.4%

Higher than 42% of US stocks

Earnings growth (YoY)
136.0%

Higher than 87% of US stocks

Gross margin
54.2%

Higher than 67% of US stocks

Operating margin
16.8%

Higher than 75% of US stocks

Net margin
10.8%

Higher than 71% of US stocks

Returns & dividend
Return on equity
51.5%

Higher than 93% of US stocks

Return on assets
8.9%

Higher than 90% of US stocks

Dividend yield
4.3%

Higher than 79% of US dividend payers

Bars mark the percentile across the ~4,600 US stocks Ticker Nerd covers, among those reporting the figure.

Key statistics

PepsiCo, Inc. (PEP) statistics: revenue, profit & scale

The headline figures, each with its date. Every row carries its own link — cite it straight from here.

  • PepsiCo, Inc. has a market value of $188.0B and an enterprise value of $230.5B.

  • Revenue in the twelve months to 30 June 2026: $96.9B. The latest quarter grew 6.4% year on year.

  • Net income over the same four quarters: $10.5B, a 10.9% net margin.

  • Diluted earnings per share, trailing twelve months: $7.63.

  • Free cash flow in the twelve months to 30 June 2026: $9.3B, after $4.2B of capital spending.

  • PepsiCo, Inc. spent $985.0M on share buybacks and $7.8B on dividends in the twelve months to 30 June 2026.

  • Shares outstanding: 1.4B.

  • Trailing P/E: 18.1×; forward P/E: 15.3× — the forward figure prices analyst consensus estimates, not reported earnings.

  • Forward dividend yield: 4.30%, paying out 75% of earnings.

  • PepsiCo, Inc. employs 306,000 people $317K of revenue per employee.

Statement figures: company filings via Twelve Data, four quarters to 30 June 2026 · market figures as at 6 Sept 2026

Data provided by Twelve Data

Peers

PEP vs competitors

The nearest names by industry and size, scored by the same model — like for like.

Its peer group, ranked by the same modelBeverages - Non-Alcoholic
CompanyMarket capTKN rank
PEPPepsiCo, Inc.$188.0B
63
KOThe Coca-Cola Co.$378.8B
90
MNSTMonster Beverage Corp.$85.8B
81
CCEPCoca-Cola Europacific Partners PLC$47.5B
70
KDPKeurig Dr Pepper, Inc.$44.3B
35
COKECoca-Cola Consolidated, Inc.$12.6B
68
CELHCelsius Holdings, Inc.$7.9B
27

Look up any of the roughly 4,600 stocks we score.

The rank is the raw material. Whether the rules would actually own PepsiCo, Inc. — and when they’d sell — is the membership. See the Ticker Nerd 20 →

News

Latest PEP news & analysis

PepsiCo's Snack Portfolio: What's Driving Volume Gains?

Zacks Investment Research · 7 Sept 2026positive

PepsiCo's snack business is gaining momentum, driven by international demand, product innovation and affordability. Global convenient foods organic volume rose 3% in the second quarter.

Why it matters — A 3% organic volume increase in PepsiCo's convenient-foods segment points to resilience in its snack portfolio, a key part of the company's overall growth.

What's Wrong With PepsiCo Stock?

The Motley Fool · 7 Sept 2026negative

PepsiCo's stock has fallen 12% over the past five years, underperforming both the S&P 500 and Coca-Cola during that period. While the company's growth has been modest, it has been in line with its major rival's growth.

Why it matters — PepsiCo watchers would care because the company's stock has lagged the broader market and its chief competitor over a five-year period, signaling underwhelming shareholder returns.

PepsiCo: An Undervalued Dividend Machine Worth A Second Look

Seeking Alpha · 7 Sept 2026positive

Seeking Alpha discusses PepsiCo's recent underperformance versus its benchmark and some bottom-line estimate misses, while highlighting the company's steady top and bottom line growth and defensive, dividend-paying nature. The article maintains confidence in PepsiCo's long-term value and its premium valuation.

Why it matters — A PepsiCo watcher would care because the piece affirms the company's stable growth and defensive dividend profile even amid recent benchmark underperformance and estimate misses.

PepsiCo Hasn't Been This Cheap Relative to Free Cash Flow in 10 Years. Here's Why That's the Signal to Buy.

The Motley Fool · 6 Sept 2026positive

PepsiCo shares have performed poorly since 2023 due to lackluster revenue, but recent adjustments and improvements have quietly rekindled earnings growth. The article notes the stock has not been this inexpensive relative to free cash flow in 10 years.

Why it matters — A PepsiCo watcher would care because the piece highlights a decade-low valuation relative to free cash flow alongside a renewed uptick in earnings growth for the company.

PepsiCo At 16 Times Earnings With A 4.3% Yield Is A Steal

Seeking Alpha · 6 Sept 2026positive

Seeking Alpha reports that after a market overreaction to a small EPS miss and soft North American volumes, PepsiCo trades at about 16x 2026 earnings with a 4.3% yield. The international segment is on track to exceed $40B in revenue, management reaffirmed full-year guidance, and the company continues investing in marketing and productivity.

Why it matters — A PepsiCo watcher would care because the article highlights improving international growth and management confidence in the company's turnaround despite soft North American volumes and near-term earnings pressure.

FAQ

Frequently asked questions about PEP stock

What is the PEP stock price forecast for 2026-2027?

The 24 Wall Street analysts covering PepsiCo, Inc. have a median 12-month price target of $155, with estimates ranging from $124 to $183. These are third-party analyst estimates, not Ticker Nerd forecasts, and they are frequently wrong.

Is PEP stock a buy right now?

Of the 24 analysts covering PepsiCo, Inc., 7 rate it a Buy, 16 a Hold and 1 a Sell. Ticker Nerd's systematic factor model ranks PepsiCo, Inc. 63 out of 100 across roughly 4,600 US stocks as at 5 Sept 2026. None of this is personal advice — it does not consider your circumstances.

How does Ticker Nerd's model rank PEP?

As at 5 Sept 2026, PepsiCo, Inc. ranks 63 out of 100 on Ticker Nerd's systematic factor model — a percentile across roughly 4,600 US stocks, built from its factor families. Its strongest factor family is Volatility (94 of 100).

Will PEP stock go up?

No one can know that. What the data says: the median 12-month target from 24 analysts implies +12.6% from the last close, and Ticker Nerd's factor model ranks PepsiCo, Inc. 63 out of 100 as at 5 Sept 2026. Analyst targets are third-party estimates and frequently wrong; none of this is personal advice.

What is the PEP stock forecast for 2030?

No analyst covering PepsiCo, Inc. publishes a 2030 price target — Wall Street targets run 12 to 18 months out. Sites quoting a 2030 price for PEP are extrapolating price history, which says nothing about the business. The furthest attributed numbers are the current analyst targets: $124 to $183 over the next 12 months.

How has PEP stock performed over the past year?

PepsiCo, Inc. returned -1.7% over the 12 months to 4 Sept 2026, with dividends reinvested. Past performance does not indicate future returns.

What does PepsiCo, Inc. do?

PepsiCo, Inc. is a global food and beverage company that develops, markets, and distributes a broad portfolio of snacks, packaged foods, and non-alcoholic drinks.

What is the latest news on PEP?

The most recent item we track (Zacks Investment Research, 7 Sept 2026): "PepsiCo's Snack Portfolio: What's Driving Volume Gains?". PepsiCo's snack business is gaining momentum, driven by international demand, product innovation and affordability. Global convenient foods organic volume rose 3% in the second quarter.

Company

About PepsiCo, Inc.

PepsiCo, Inc. is a global food and beverage company that develops, markets, and distributes a broad portfolio of snacks, packaged foods, and non-alcoholic drinks. PepsiCo’s current business is organized around convenient foods and beverages, with brands spanning salty snacks, cereals, ready-to-drink beverages, sports drinks, bottled water, and flavored soft drinks. Its products reach consumers through grocery, convenience, foodservice, and e-commerce channels across more than 200 countries and territories. The company plays a major role in the consumer staples market by supplying everyday food and beverage products to households, retailers, and institutions. PepsiCo, Inc. is headquartered in Purchase, New York.

CEO Mr. Ramon Luis Laguarta · 306,000 employees · United States · https://www.pepsico.com