RCATRCATIndustrials · Aerospace & Defense

RCAT Stock Forecast: Red Cat Holdings, Inc. Price Predictions for 2026-2027

Last close, 7 Oct 2026
$6.15
−3.00% on the day

The 8 Wall Street analysts covering Red Cat Holdings, Inc. hold a median 12-month price target of $15 — +143.9% from the last close. Ticker Nerd's systematic factor model, run across ~4,600 US stocks, ranks it 4 of 100 as at 6 Oct 2026 — in the weakest quartile. The Street sees upside; the factor read is a caution. That gap is the story on this page.

Market cap
$969.0M
Ticker Nerd rank
4 / 100
Median analyst target
$15
Analysts covering
8
Revenue$20.2M+527.3% y/y
Operating income−$38.6M
Net income−$35.2M
Free cash flow−$52.6M
Quarterly, 8 quarters to 30 June 2026 · latest quarter's figure shown
Total return, dividends reinvested
1W
−4.8%
1M
−26.5%
YTD
−22.4%
1Y
−58.4%
From 52W high
−64.6%
From 52W low
+0.2%
$6
$17
52-week range, adjusted closes · the dot is the last close
Ticker Nerd rank

RCAT stock analysis: one number for the whole business

Consensus tells you what everyone already believes. The model scores Red Cat Holdings, Inc. on its factor families — the same systematic rank behind the Ticker Nerd portfolio.

Where the model ranks itAs at 6 Oct 2026
4 / 100

Percentile across ~4,600 US stocks on Ticker Nerd’s systematic factor model. Higher is better. How the model is built and tested

Size
45
Momentum
39
Issuance
38
Revisions
27
Volatility
19
Value
15
Quality
13
Accruals
12
Growth
5

Size (45): Smaller than most of the companies we track.

Growth (5): Sales and profits are flat, shrinking, or growing more slowly than they were.

Built and run by Aslam Ghouse, an ex-Goldman Sachs quant trader with fourteen years in markets.

Wall Street

RCAT stock forecast 2026-2027: analyst price targets & predictions

The bullish and bearish analyst opinions on RCAT, reported as data — targets and ratings, the market's view beside the model's.

Share price and the analyst range, 12 monthsAdjusted close, US dollars
$5$10$15$20$25Jan 26Apr 26Jul 26Oct 26RCATHigh $25Median $15Low $9

Price targets and ratings are third-party analyst estimates, reported here as data. They are not Ticker Nerd forecasts, and they are frequently wrong.

Data provided by Twelve Data

What Wall Street says8 analysts
7 Buy1 Hold0 Sell
Low $9Median $15High $25

The green dot is the last close — the median target sits +143.9% from it.

Recent analyst actionsNewest first
DateFirmActionRatingTarget
2 Sept 2026Piper SandlerInitiatesNeutral$9.00
31 Aug 2026Evercore ISI GroupInitiatesOutperform$15
7 Aug 2026HC Wainwright & Co.ReiteratesBuy—
7 Aug 2026HC Wainwright & Co.ReiteratesBuy$20
7 Aug 2026NeedhamMaintainsBuy$20 → $15
7 Aug 2026NeedhamMaintainsBuy—
1 June 2026Roth CapitalInitiatesBuy$25
1 June 2026Roth CapitalInitiatesBuy—
27 May 2026HC Wainwright & Co.InitiatesBuy—
27 May 2026HC Wainwright & Co.InitiatesBuy$20
19 Mar 2026NeedhamMaintainsBuy—
3 Mar 2026Ladenburg ThalmannMaintainsBuy—
2 Mar 2026NeedhamReiteratesBuy—
13 Jan 2026NeedhamMaintainsBuy—
14 Nov 2025NeedhamMaintainsBuy—
3 Oct 2025NeedhamInitiatesBuy—
11 Mar 2025Northland Capital MarketsInitiatesOutperform—
14 June 2024Ladenburg ThalmannInitiatesBuy—

Price targets and ratings are third-party analyst estimates, reported here as data. They are not Ticker Nerd forecasts, and they are frequently wrong.

Market Radar

This page is one stock. Monday covers all of them.

Computed off the Friday close and sent before the US open.

Market Radar reports the week’s largest rank changes across roughly 4,600 US stocks, the factor behind each one, and where the market went. RCAT appears on the weeks it earns a place.

Free, every Monday. Unsubscribe any time.

Performance

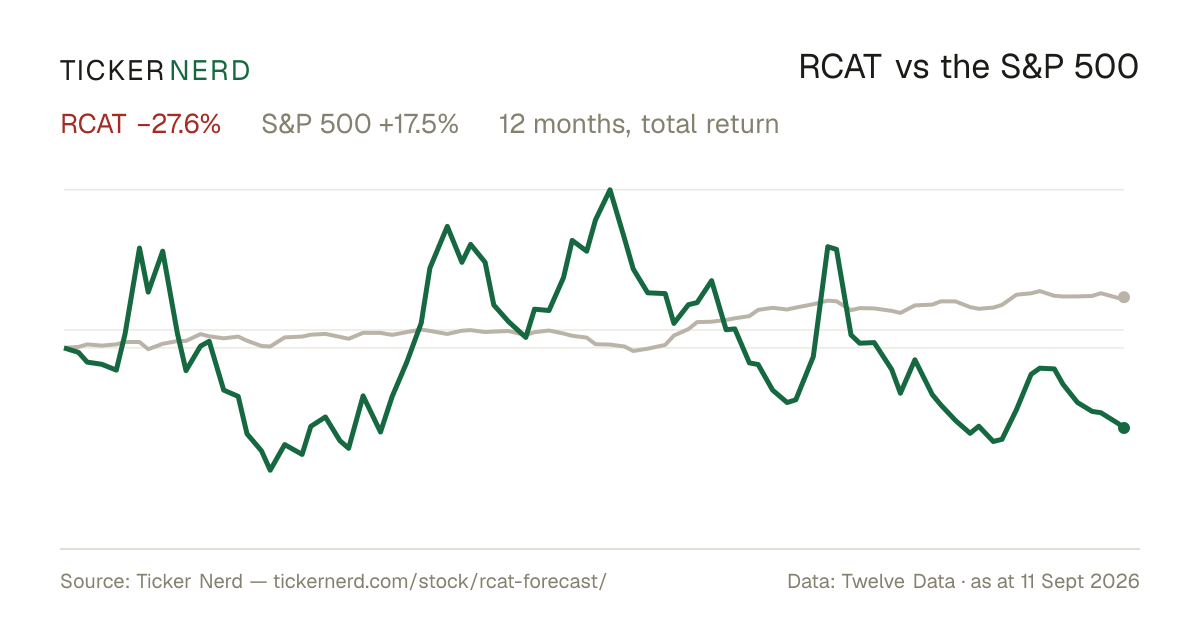
RCAT vs the S&P 500

Both lines are total return — dividends reinvested — so the comparison is honest on both sides.

Over the twelve months to 7 Oct 2026, Red Cat Holdings, Inc. returned −58.4% against +17.7% for the S&P 500, dividends included.

RCAT vs S&P 500, last 12 monthsTotal return, rebased to 100
406080100120Jan 26Apr 26Jul 26Oct 26RCATS&P 500

Download this chart as an image — free to reuse; link this page as the source.

Data provided by Twelve Data

Estimates

RCAT analyst estimate revisions

Not the forecast itself — the direction analysts are revising it. Revision direction is one of the model's factor families.

Which way the estimates are movingNext fiscal year
Analysts raising
0
Analysts cutting
1
Fundamentals

Red Cat Holdings, Inc. (RCAT) financial data

A margin means little on its own. Each bar marks where the figure sits across the whole US universe we score.

Valuation
Trailing P/E
−8.7×

Cheaper than 92% of US stocks

Price / sales
13.5×

Cheaper than 12% of US stocks

Price / book
2.1×

Cheaper than 43% of US stocks

EV / EBITDA
−6.3×

Cheaper than 81% of US stocks

Growth & margins
Revenue growth (YoY)
527.2%

Higher than 98% of US stocks

Earnings growth (YoY)
527.3%

Higher than 95% of US stocks

Gross margin
16.1%

Higher than 16% of US stocks

Operating margin
−191.4%

Higher than 11% of US stocks

Net margin
−136.3%

Higher than 4% of US stocks

Returns & dividend
Return on equity
−34.4%

Higher than 26% of US stocks

Return on assets
−20.7%

Higher than 19% of US stocks

Dividend yield
0.0%

Higher than 1% of US dividend payers

Bars mark the percentile across the ~4,600 US stocks Ticker Nerd covers, among those reporting the figure.

Key statistics

Red Cat Holdings, Inc. (RCAT) statistics: revenue, profit & scale

The headline figures, each with its date. Every row carries its own link — cite it straight from here.

  • Red Cat Holdings, Inc. has a market value of $969.0M and an enterprise value of $658.3M.

  • Revenue in the twelve months to 30 June 2026: $71.5M. The latest quarter grew 527.2% year on year.

  • Net income over the same four quarters: −$97.5M, a −136.2% net margin.

  • Diluted earnings per share, trailing twelve months: $−0.81.

  • Free cash flow in the twelve months to 30 June 2026: −$157.7M.

  • Shares outstanding: 152.7M.

  • Trailing P/E: −8.7×; forward P/E: −11.4× — the forward figure prices analyst consensus estimates, not reported earnings.

  • Forward dividend yield: 0.00%, paying out 0% of earnings.

  • Red Cat Holdings, Inc. employs 244 people — $293K of revenue per employee.

Statement figures: company filings via Twelve Data, four quarters to 30 June 2026 · market figures as at 6 Oct 2026

Data provided by Twelve Data

Peers

RCAT vs competitors

The nearest names by industry and size, scored by the same model — like for like.

Its peer group, ranked by the same modelAerospace & Defense
CompanyMarket capTKN rank
RCATRed Cat Holdings, Inc.$969.0M
4
SATLSatellogic, Inc.$847.1M
40
NPKNational Presto Industries, Inc.$1.1B
74
CDRECadre Holdings, Inc.$1.1B
55
YSSYork Space Systems, Inc.$1.1B
0
RGRSturm, Ruger & Co., Inc.$696.0M
98
ELMTThe Elmet Group Co.$694.3M
6

Look up any of the roughly 4,600 stocks we score.

The rank is the raw material. Whether the rules would actually own Red Cat Holdings, Inc. — and when they’d sell — is the membership. See the Ticker Nerd 20 →

News

Latest RCAT news & analysis

AeroVironment Is Now Down 43% This Year. Is It Time to Sell This Dropping Drone Stock?

24/7 Wall Street · 7 Oct 2026neutral

AeroVironment is down 43% this year, with a restatement cited as the simplest explanation for its difficult year. The excerpt notes that two drone and defense peers also fell despite not issuing restatements.

Why it matters — The peer declines may be relevant context for RCAT watchers assessing weakness across drone and defense stocks, though the excerpt does not identify the peers.

Which Drone Stock Is Dominating in 2026: Red Cat, Ondas, or AeroVironment?

24/7 Wall Street · 2 Oct 2026neutral

A 24/7 Wall Street article compares drone stocks Red Cat, Ondas, and AeroVironment entering 2026, noting that rising defense demand for autonomous systems, counter-drone protection, and domestic supply chains supports the sector yet the best-known drone names have moved backward this year.

Why it matters — RCAT watchers would care because the article positions the company within a broader drone-sector comparison amid strong defense tailwinds but lagging stock performance.

Blue Ops to Bring Maritime Defense Operations to FAU Harbor Branch

PRNewsWire · 2 Oct 2026positive

Florida Atlantic University and Blue Ops, Red Cat Holdings' maritime division, established a strategic partnership to base uncrewed maritime systems operations at FAU's Harbor Branch Oceanographic Institute in Fort Pierce, creating a hub for research, development, testing, training and collaboration in ocean technology, autonomous systems and national defense.

Why it matters — This partnership positions RCAT's maritime division within a major oceanographic research institution, expanding its capabilities and presence in defense-related autonomous maritime operations.

Red Cat's Blue Ops Expands Maritime Defense Operations Through Strategic Partnership with Florida Atlantic University

GlobeNewsWire · 1 Oct 2026positive

Red Cat's Blue Ops subsidiary has entered a strategic partnership with Florida Atlantic University, gaining access to FAU Harbor Branch's deep-water facilities and maritime testing capabilities. This expands Blue Ops' U.S. footprint for developing and producing autonomous systems for U.S. and allied forces.

Why it matters — This partnership strengthens Blue Ops' maritime testing and development infrastructure, potentially supporting RCAT's growing autonomous systems business for defense markets.

Red Cat's USV Mix: Could Blue Ops Accelerate Margin Gains in H2?

Zacks Investment Research · 30 Sept 2026positive

Zacks Investment Research highlights Red Cat's Blue Ops USV revenues and production ramp as potential drivers of margin expansion, with overall gross margin expected to reach about 30% toward the end of 2026.

Why it matters — RCAT watchers would focus on this because the Blue Ops USV ramp could support meaningful margin improvement in the second half of the year.

FAQ

Frequently asked questions about RCAT stock

What is the RCAT stock price forecast for 2026-2027?

The 8 Wall Street analysts covering Red Cat Holdings, Inc. have a median 12-month price target of $15, with estimates ranging from $9 to $25. These are third-party analyst estimates, not Ticker Nerd forecasts, and they are frequently wrong.

Is RCAT stock a buy right now?

Of the 8 analysts covering Red Cat Holdings, Inc., 7 rate it a Buy, 1 a Hold and 0 a Sell. Ticker Nerd's systematic factor model ranks Red Cat Holdings, Inc. 4 out of 100 across roughly 4,600 US stocks as at 6 Oct 2026. None of this is personal advice — it does not consider your circumstances.

How does Ticker Nerd's model rank RCAT?

As at 6 Oct 2026, Red Cat Holdings, Inc. ranks 4 out of 100 on Ticker Nerd's systematic factor model — a percentile across roughly 4,600 US stocks, built from its factor families. Its strongest factor family is Size (45 of 100).

Will RCAT stock go up?

No one can know that. What the data says: the median 12-month target from 8 analysts implies +143.9% from the last close, and Ticker Nerd's factor model ranks Red Cat Holdings, Inc. 4 out of 100 as at 6 Oct 2026. Analyst targets are third-party estimates and frequently wrong; none of this is personal advice.

What is the RCAT stock forecast for 2030?

No analyst covering Red Cat Holdings, Inc. publishes a 2030 price target — Wall Street targets run 12 to 18 months out. Sites quoting a 2030 price for RCAT are extrapolating price history, which says nothing about the business. The furthest attributed numbers are the current analyst targets: $9 to $25 over the next 12 months.

How has RCAT stock performed over the past year?

Red Cat Holdings, Inc. returned -58.4% over the 12 months to 7 Oct 2026, with dividends reinvested. Past performance does not indicate future returns.

What does Red Cat Holdings, Inc. do?

Red Cat Holdings Inc. is a drone and robotics company that develops advanced unmanned systems for defense, national security, public safety, and commercial use.

What is the latest news on RCAT?

The most recent item we track (24/7 Wall Street, 7 Oct 2026): "AeroVironment Is Now Down 43% This Year. Is It Time to Sell This Dropping Drone Stock?". AeroVironment is down 43% this year, with a restatement cited as the simplest explanation for its difficult year. The excerpt notes that two drone and defense peers also fell despite not issuing restatements.

Company

About Red Cat Holdings, Inc.

Red Cat Holdings Inc. is a drone and robotics company that develops advanced unmanned systems for defense, national security, public safety, and commercial use. The company designs and manufactures small and tactical unmanned aircraft systems, including short-range reconnaissance drones, first-person-view platforms, and extended-range fixed-wing systems for intelligence, surveillance, and reconnaissance missions. Its product portfolio also includes mission management software, ground control systems, and integrated hardware and software solutions that support operations across air, land, and sea. Red Cat serves military, government, and enterprise customers with tools built for situational awareness, data collection, and multi-domain operations. Based in South Salt Lake, Utah, Red Cat Holdings Inc. plays a role in the growing market for American-made drone technology and autonomous systems.

CEO Mr. Jeffrey M. Thompson · 244 employees · United States · https://redcat.red