RENXReal Estate · Real Estate - Development

RENX Stock Forecast: RenX Enterprises Corp. Price Predictions for 2026-2027

Last close, 24 Aug 2026
$1.97
+2.07% on the day

Ticker Nerd's systematic factor model, run across ~4,600 US stocks, ranks it 21 of 100 as at 22 Aug 2026 — in the weakest quartile.

Market cap
$5.1M
Ticker Nerd rank
21 / 100
Median analyst target
Analysts covering
0
Revenue$4.0M
Operating income−$2.8M
Net income−$9.3M
Free cash flow−$2.5M
Quarterly, 7 quarters to 31 Mar 2026 · latest quarter's figure shown
Total return, dividends reinvested
1W
+10.7%
1M
−1.5%
YTD
−48.2%
1Y
−92.0%
From 52W high
−93.8%
From 52W low
+38.7%
$1
$32
52-week range, adjusted closes · the dot is the last close
Ticker Nerd rank

RENX stock analysis: one number for the whole business

Consensus tells you what everyone already believes. The model scores RenX Enterprises Corp. on its factor families — the same systematic rank behind the Ticker Nerd portfolio.

Where the model ranks itAs at 22 Aug 2026
21 / 100

Percentile across ~4,600 US stocks on Ticker Nerd’s systematic factor model. Higher is better. How the model is built and tested

Size
96
Accruals
73
Growth
60
Issuance
46
Revisions
25
Momentum
20
Value
9
Quality
7
Volatility
3

Size (96): Smaller than most of the companies we track.

Volatility (3): The share price moves around a lot.

Built and run by Aslam Ghouse, an ex-Goldman Sachs quant trader with fourteen years in markets.

Wall Street

RENX stock forecast 2026-2027: analyst price targets & predictions

The bullish and bearish analyst opinions on RENX, reported as data — targets and ratings, the market's view beside the model's.

Share price and the analyst range, 12 monthsAdjusted close, US dollars
$0$10$20$30Oct 25Jan 26Apr 26Jul 26RENX

Price targets and ratings are third-party analyst estimates, reported here as data. They are not Ticker Nerd forecasts, and they are frequently wrong.

Data provided by Twelve Data

Price targets and ratings are third-party analyst estimates, reported here as data. They are not Ticker Nerd forecasts, and they are frequently wrong.

Market Radar

This page is one stock. Monday covers all of them.

Computed off the Friday close and sent before the US open.

Market Radar reports the week’s largest rank changes across roughly 4,600 US stocks, the factor behind each one, and where the market went. RENX appears on the weeks it earns a place.

Free, every Monday. Unsubscribe any time.

Performance

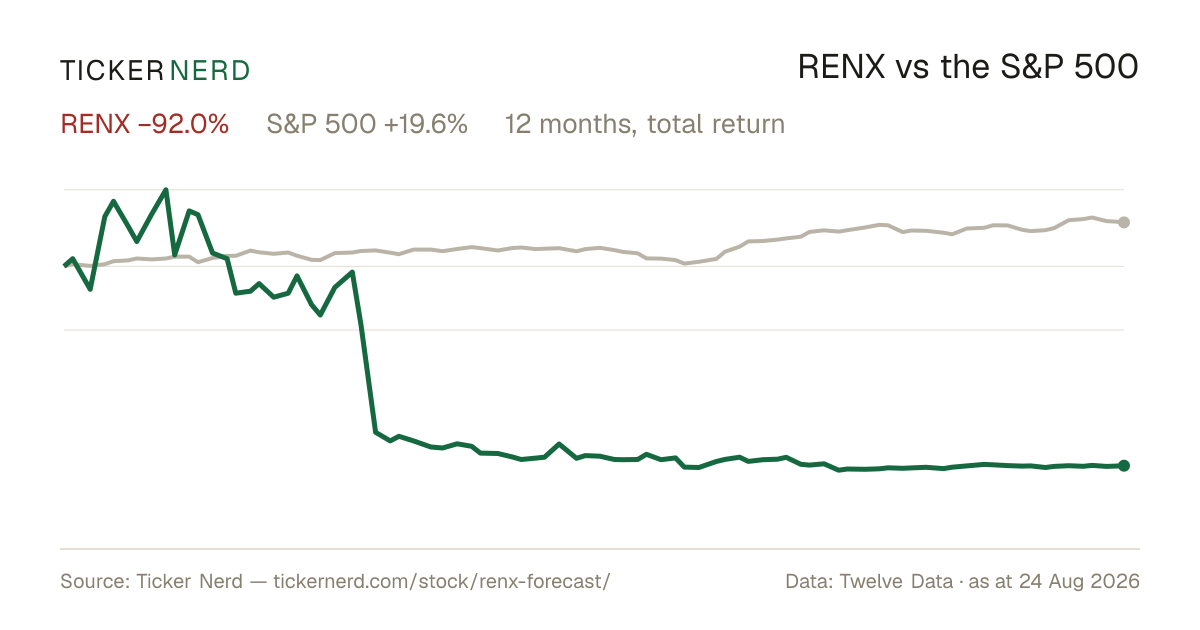
RENX vs the S&P 500

Both lines are total return — dividends reinvested — so the comparison is honest on both sides.

Over the twelve months to 24 Aug 2026, RenX Enterprises Corp. returned −92.0% against +19.6% for the S&P 500, dividends included.

RENX vs S&P 500, last 12 monthsTotal return, rebased to 100
050100Oct 25Jan 26Apr 26Jul 26RENXS&P 500

Download this chart as an image — free to reuse; link this page as the source.

Data provided by Twelve Data

Estimates

RENX analyst estimate revisions

Not the forecast itself — the direction analysts are revising it. Revision direction is one of the model's factor families.

Which way the estimates are movingNext fiscal year
Analysts raising
0
Analysts cutting
0
Fundamentals

RenX Enterprises Corp. (RENX) financial data

A margin means little on its own. Each bar marks where the figure sits across the whole US universe we score.

Valuation
Trailing P/E
−0.0×

Cheaper than 76% of US stocks

Price / sales
0.3×

Cheaper than 88% of US stocks

Price / book
3.9×

Cheaper than 28% of US stocks

EV / EBITDA
−3.4×

Cheaper than 75% of US stocks

Growth & margins
Revenue growth (YoY)
203.4%

Higher than 96% of US stocks

Earnings growth (YoY)
Gross margin
33.7%

Higher than 41% of US stocks

Operating margin
−70.4%

Higher than 15% of US stocks

Net margin
−169.2%

Higher than 3% of US stocks

Returns & dividend
Return on equity
−444.8%

Higher than 3% of US stocks

Return on assets
−17.8%

Higher than 21% of US stocks

Dividend yield

Bars mark the percentile across the ~4,600 US stocks Ticker Nerd covers, among those reporting the figure.

Key statistics

RenX Enterprises Corp. (RENX) statistics: revenue, profit & scale

The headline figures, each with its date. Every row carries its own link — cite it straight from here.

  • RenX Enterprises Corp. has a market value of $5.1M and an enterprise value of $27.4M.

  • Revenue in the twelve months to 31 Mar 2026: $12.2M. The latest quarter grew 203.4% year on year.

  • Net income over the same four quarters: −$23.1M, a −190.0% net margin.

  • Free cash flow in the twelve months to 31 Mar 2026: −$12.9M, after $3.9M of capital spending.

  • Shares outstanding: 2.5M.

  • Trailing P/E: −0.0×; forward P/E: −0.6× — the forward figure prices analyst consensus estimates, not reported earnings.

  • RenX Enterprises Corp. employs 36 people $338K of revenue per employee.

Statement figures: company filings via Twelve Data, four quarters to 31 Mar 2026 · market figures as at 23 Aug 2026

Data provided by Twelve Data

Peers

RENX vs competitors

The nearest names by industry and size, scored by the same model — like for like.

Its peer group, ranked by the same modelReal Estate - Development
CompanyMarket capTKN rank
RENXRenX Enterprises Corp.$5.1M
21
MRNOMurano Global Investments Plc$17.3M
2
AEIAlset, Inc.$56.8M
17
JFBJFB Construction Holdings$91.2M
21
LPALogistic Properties of the Americas$100.9M
46
AXRAMREP Corp.$122.0M
66
GBRNew Concept Energy, Inc.*$4.2M
50

* Nearest Real Estate names by size — few real estate - development companies of this scale trade in the US universe.

Look up any of the roughly 4,600 stocks we score.

The rank is the raw material. Whether the rules would actually own RenX Enterprises Corp. — and when they’d sell — is the membership. See the Ticker Nerd 20 →

News

Latest RENX news & analysis

RenX Enterprises Announces $2.6 Million Sale Agreement for Norman Berry Property

Accesswire · 21 Aug 2026positive

RenX Enterprises announced a purchase and sale agreement under which a joint venture in which its subsidiary holds a 50% interest will sell the Norman Berry property, a 7.7-acre parcel in East Point, Fulton County, Georgia, for $2.6 million to a Florida-based real estate development company. Proceeds are expected to provide non-dilutive funding for core operations at Myakka City and to reduce existing real estate debt.

Why it matters — RENX watchers would care because the sale represents a potential source of non-dilutive funding and debt reduction without issuing new shares.

RenX Enterprises Corp. Reports Second Quarter 2026 Results: Record Quarterly Revenue of $4.26 Million, Logistics Segment Profitable for Second Consecutive Quarter

Accesswire · 13 Aug 2026positive

RenX Enterprises Corp. reported Q2 2026 results for the three and six months ended June 30, 2026, posting record quarterly revenue of $4.26 million with both primary operating segments showing sequential revenue growth. The quarter also marked a second consecutive profitable quarter for the Logistics segment, progress on the Microtec UTM 1200 Turbo Mill (in transit to Myakka City for second-half 2026 commissioning), and the launch of a Land Clearing Division with its first purchase order.

Why it matters — RENX watchers would note the record revenue, sustained Logistics segment profitability, and the advancing Microtec mill initiative that management expects to be its biggest business driver through 2027 and beyond.

RenX Enterprises Launches Land Clearing Division and Wins First Purchase Order

GlobeNewsWire · 28 July 2026positive

RenX Enterprises Corp. announced the launch of a new land clearing division and receipt of its first purchase order from a regional land development company for services at a Florida project site.

Why it matters — The launch of a new division and its first purchase order signals business expansion and a potential new revenue stream for RenX.

FAQ

Frequently asked questions about RENX stock

How does Ticker Nerd's model rank RENX?

As at 22 Aug 2026, RenX Enterprises Corp. ranks 21 out of 100 on Ticker Nerd's systematic factor model — a percentile across roughly 4,600 US stocks, built from its factor families. Its strongest factor family is Size (96 of 100).

What is the RENX stock forecast for 2030?

No analyst covering RenX Enterprises Corp. publishes a 2030 price target — Wall Street targets run 12 to 18 months out. Sites quoting a 2030 price for RENX are extrapolating price history, which says nothing about the business.

How has RENX stock performed over the past year?

RenX Enterprises Corp. returned -92.0% over the 12 months to 24 Aug 2026, with dividends reinvested. Past performance does not indicate future returns.

What does RenX Enterprises Corp. do?

RenX Enterprises Corp is a real estate development and environmental solutions company formed in 2021. The business originated with a focus on acquiring and developing properties across the United States for future green single-family and multifamily housing projects, emphasizing sustainable construction and resource-efficient communities.

What is the latest news on RENX?

The most recent item we track (Accesswire, 21 Aug 2026): "RenX Enterprises Announces $2.6 Million Sale Agreement for Norman Berry Property". RenX Enterprises announced a purchase and sale agreement under which a joint venture in which its subsidiary holds a 50% interest will sell the Norman Berry property, a 7.7-acre parcel in East Point, Fulton County, Georgia, for $2.6 million to a Florida-based real estate development company. Proceeds are expected to provide non-dilutive funding for core operations at Myakka City and to reduce existing real estate debt.

Company

About RenX Enterprises Corp.

RenX Enterprises Corp is a real estate development and environmental solutions company formed in 2021. The business originated with a focus on acquiring and developing properties across the United States for future green single-family and multifamily housing projects, emphasizing sustainable construction and resource-efficient communities. Over time, RenX Enterprises Corp has expanded its activities into environmental processing, operating an organics processing and logistics platform anchored by a permitted facility in Florida. Through this platform, the company processes source-separated green waste and is moving into the production of sustainable, higher-margin potting media and engineered soil substrates using advanced milling technologies. This integrated approach is supported by a logistics operation that provides transportation services for biomass, solid waste, and recyclable materials, serving both internal needs and third-party customers. By combining real estate development with renewable-resource manufacturing and regenerative land-use solutions, RenX Enterprises Corp occupies a niche at the intersection of property development, environmental services, and sustainable materials within the broader real estate management and development sector.

CEO Mr. David Villarreal Jr. · 36 employees · United States · https://www.renxent.com