STRASTRAConsumer Defensive · Education & Training Services

STRA Stock Forecast: Strategic Education, Inc. Price Predictions for 2026-2027

Last close, 3 Sept 2026
$82
−0.34% on the day

The 3 Wall Street analysts covering Strategic Education, Inc. hold a median 12-month price target of $100 — +22.1% from the last close. Ticker Nerd's systematic factor model, run across ~4,600 US stocks, ranks it 95 of 100 as at 2 Sept 2026 — among the strongest tenth. Here, the model and the Street point the same way.

Market cap
$1.9B
Ticker Nerd rank
95 / 100
Median analyst target
$100
Analysts covering
3
Revenue$337.3M+4.9% y/y
Operating income$52.9M
Net income$37.2M
Free cash flow$15.0M
Quarterly, 8 quarters to 30 June 2026 · latest quarter's figure shown
Total return, dividends reinvested
1W
−4.3%
1M
−2.2%
YTD
+3.7%
1Y
+2.0%
From 52W high
−6.5%
From 52W low
+14.4%
$72
$88
52-week range, adjusted closes · the dot is the last close
Ticker Nerd rank

STRA stock analysis: one number for the whole business

Consensus tells you what everyone already believes. The model scores Strategic Education, Inc. on its factor families — the same systematic rank behind the Ticker Nerd portfolio.

Where the model ranks itAs at 2 Sept 2026
95 / 100

Percentile across ~4,600 US stocks on Ticker Nerd’s systematic factor model. Higher is better. How the model is built and tested

Issuance
94
Volatility
91
Value
86
Accruals
72
Growth
71
Quality
68
Revisions
67
Momentum
64
Size
37

Issuance (94): The share count has been shrinking and the company is not leaning on new borrowing.

Momentum (64): The shares have been drifting down relative to others.

Size (37): Larger than most of the companies we track — more scrutinised, less often mispriced.

Built and run by Aslam Ghouse, an ex-Goldman Sachs quant trader with fourteen years in markets.

Wall Street

STRA stock forecast 2026-2027: analyst price targets & predictions

The bullish and bearish analyst opinions on STRA, reported as data — targets and ratings, the market's view beside the model's.

Share price and the analyst range, 12 monthsAdjusted close, US dollars
$70$80$90$100$110Oct 25Jan 26Apr 26Jul 26STRAHigh $105Median $100Low $90

Price targets and ratings are third-party analyst estimates, reported here as data. They are not Ticker Nerd forecasts, and they are frequently wrong.

Data provided by Twelve Data

What Wall Street says3 analysts
2 Buy1 Hold0 Sell
Low $90Median $100High $105

The green dot is the last close — the median target sits +22.1% from it.

Recent analyst actionsNewest first
DateFirmActionRatingTarget
30 July 2026Truist SecuritiesMaintainsHold$80$90
6 July 2026BMO CapitalMaintainsOutperform$86$91
6 July 2026BMO CapitalMaintainsOutperform
27 Apr 2026BMO CapitalMaintainsOutperform
27 Apr 2026Truist SecuritiesMaintainsHold
23 Apr 2026Barrington ResearchMaintainsOutperform
24 Mar 2026Truist SecuritiesDowngradeHold
26 Jan 2026Barrington ResearchMaintainsOutperform
18 Dec 2025Barrington ResearchMaintainsOutperform
7 Nov 2025Barrington ResearchMaintainsOutperform
21 Oct 2025Barrington ResearchMaintainsOutperform
1 Aug 2025BMO CapitalMaintainsOutperform
30 July 2025Barrington ResearchMaintainsOutperform
22 July 2025Barrington ResearchMaintainsOutperform
28 Apr 2025BMO CapitalMaintainsOutperform
15 Apr 2025Barrington ResearchMaintainsOutperform
3 Mar 2025BMO CapitalMaintainsOutperform
27 Feb 2025Barrington ResearchMaintainsOutperform
21 Jan 2025Barrington ResearchMaintainsOutperform
7 Nov 2024Barrington ResearchMaintainsOutperform

Price targets and ratings are third-party analyst estimates, reported here as data. They are not Ticker Nerd forecasts, and they are frequently wrong.

Market Radar

This page is one stock. Monday covers all of them.

Computed off the Friday close and sent before the US open.

Market Radar reports the week’s largest rank changes across roughly 4,600 US stocks, the factor behind each one, and where the market went. STRA appears on the weeks it earns a place.

Free, every Monday. Unsubscribe any time.

Performance

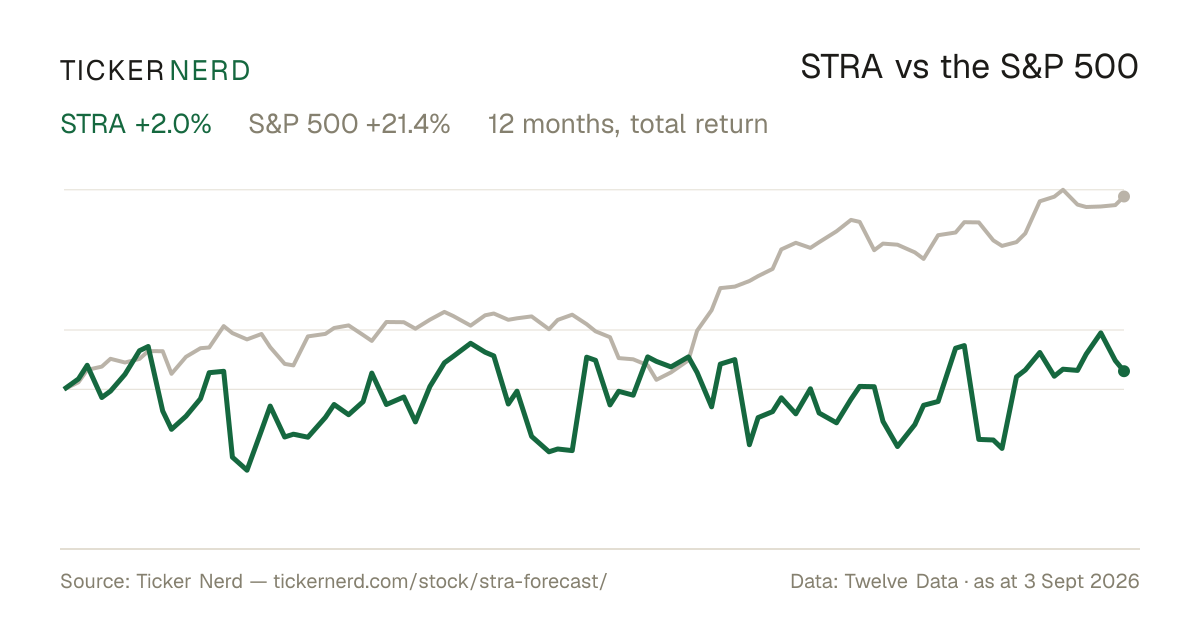
STRA vs the S&P 500

Both lines are total return — dividends reinvested — so the comparison is honest on both sides.

Over the twelve months to 3 Sept 2026, Strategic Education, Inc. returned +2.0% against +21.4% for the S&P 500, dividends included.

STRA vs S&P 500, last 12 monthsTotal return, rebased to 100
90100110120Oct 25Jan 26Apr 26Jul 26STRAS&P 500

Download this chart as an image — free to reuse; link this page as the source.

Data provided by Twelve Data

Estimates

STRA analyst estimate revisions

Not the forecast itself — the direction analysts are revising it. Revision direction is one of the model's factor families.

Which way the estimates are movingNext fiscal year
EPS revision, 90 days
+0.3%
Analysts raising
2
Analysts cutting
1
Fundamentals

Strategic Education, Inc. (STRA) financial data

A margin means little on its own. Each bar marks where the figure sits across the whole US universe we score.

Valuation
Trailing P/E
13.9×

Cheaper than 49% of US stocks

Price / sales
1.4×

Cheaper than 61% of US stocks

Price / book
1.1×

Cheaper than 70% of US stocks

EV / EBITDA
7.3×

Cheaper than 48% of US stocks

Growth & margins
Revenue growth (YoY)
4.9%

Higher than 39% of US stocks

Earnings growth (YoY)
14.9%

Higher than 53% of US stocks

Gross margin
47.3%

Higher than 59% of US stocks

Operating margin
15.7%

Higher than 73% of US stocks

Net margin
10.5%

Higher than 71% of US stocks

Returns & dividend
Return on equity
8.2%

Higher than 59% of US stocks

Return on assets
6.1%

Higher than 81% of US stocks

Dividend yield
2.9%

Higher than 62% of US dividend payers

Bars mark the percentile across the ~4,600 US stocks Ticker Nerd covers, among those reporting the figure.

Key statistics

Strategic Education, Inc. (STRA) statistics: revenue, profit & scale

The headline figures, each with its date. Every row carries its own link — cite it straight from here.

  • Strategic Education, Inc. has a market value of $1.9B and an enterprise value of $1.8B.

  • Revenue in the twelve months to 30 June 2026: $1.3B. The latest quarter grew 4.9% year on year.

  • Net income over the same four quarters: $134.5M, a 10.5% net margin.

  • Diluted earnings per share, trailing twelve months: $6.00.

  • Free cash flow in the twelve months to 30 June 2026: $168.6M.

  • Strategic Education, Inc. spent $151.6M on share buybacks and $55.3M on dividends in the twelve months to 30 June 2026.

  • Shares outstanding: 22.6M.

  • Trailing P/E: 13.9×; forward P/E: 9.9× — the forward figure prices analyst consensus estimates, not reported earnings.

  • Forward dividend yield: 2.88%, paying out 40% of earnings.

  • Strategic Education, Inc. employs 3,683 people $349K of revenue per employee.

Statement figures: company filings via Twelve Data, four quarters to 30 June 2026 · market figures as at 1 Sept 2026

Data provided by Twelve Data

Peers

STRA vs competitors

The nearest names by industry and size, scored by the same model — like for like.

Its peer group, ranked by the same modelEducation & Training Services
CompanyMarket capTKN rank
STRAStrategic Education, Inc.$1.9B
95
PRDOPerdoceo Education Corp.$2.1B
94
COURCoursera, Inc.$1.6B
51
MHMcGraw Hill, Inc.$2.5B
64
AFYAAfya Ltd.$1.3B
85
UTIUniversal Technical Institute, Inc.$1.1B
21
PXEDPhoenix Education Partners, Inc.$1.1B
47

Look up any of the roughly 4,600 stocks we score.

The rank is the raw material. Whether the rules would actually own Strategic Education, Inc. — and when they’d sell — is the membership. See the Ticker Nerd 20 →

News

Latest STRA news & analysis

Why Is Strategic Education (STRA) Up 0.6% Since Last Earnings Report?

Zacks Investment Research · 28 Aug 2026neutral

Strategic Education (STRA) reported earnings 30 days ago, and its stock has risen 0.6% since that report. The article examines what the earnings result could mean for the company going forward.

Why it matters — A Strategic Education watcher would care because the article assesses how the most recent earnings report has influenced the stock's performance and what investors can expect next.

Strategic Education (STRA) Just Flashed Golden Cross Signal: Do You Buy?

Zacks Investment Research · 26 Aug 2026positive

Strategic Education Inc. (STRA) reached a significant support level, and its 50-day simple moving average crossed above its 200-day simple moving average, a technical pattern known as a "golden cross." The report highlights this as a notable technical development for the stock.

Why it matters — STRA watchers would care because the golden cross and support level are widely watched technical signals that can indicate a shift in the stock's price trend.

Why Strategic Education (STRA) is a Top Momentum Stock for the Long-Term

Zacks Investment Research · 21 Aug 2026positive

Zacks Investment Research highlighted Strategic Education (STRA) as a top momentum stock for the long term, using its Zacks Style Scores feature of the Zacks Premium research service to identify the company as a strong pick for momentum investors.

Why it matters — A positive momentum designation from a research service could draw investor attention to STRA as a long-term holding.

Here's Why Strategic Education (STRA) is a Strong Value Stock

Zacks Investment Research · 20 Aug 2026positive

Zacks Investment Research highlighted Strategic Education (STRA) as a strong value stock, noting that such assessments are supported by the Zacks Style Scores feature of its Premium research service.

Why it matters — A positive value ranking from a widely followed research service could draw investors' attention to STRA's valuation characteristics.

Strategic Education, Inc. and Leading Education Investors Seek Edtech Innovators for Second Signal Labs Cohort

Business Wire · 12 Aug 2026neutral

Strategic Education, Inc. announced it is seeking applications for the second cohort of its Signal Labs program, inviting edtech innovators to join alongside leading education investors. The call for applications was issued via Business Wire from the company's Herndon, Virginia headquarters.

Why it matters — This signals that STRA is actively engaging with the edtech innovation ecosystem, which could broaden its reach and partnerships in the education-technology space.

FAQ

Frequently asked questions about STRA stock

What is the STRA stock price forecast for 2026-2027?

The 3 Wall Street analysts covering Strategic Education, Inc. have a median 12-month price target of $100, with estimates ranging from $90 to $105. These are third-party analyst estimates, not Ticker Nerd forecasts, and they are frequently wrong.

Is STRA stock a buy right now?

Of the 3 analysts covering Strategic Education, Inc., 2 rate it a Buy, 1 a Hold and 0 a Sell. Ticker Nerd's systematic factor model ranks Strategic Education, Inc. 95 out of 100 across roughly 4,600 US stocks as at 2 Sept 2026. None of this is personal advice — it does not consider your circumstances.

How does Ticker Nerd's model rank STRA?

As at 2 Sept 2026, Strategic Education, Inc. ranks 95 out of 100 on Ticker Nerd's systematic factor model — a percentile across roughly 4,600 US stocks, built from its factor families. Its strongest factor family is Issuance (94 of 100).

Will STRA stock go up?

No one can know that. What the data says: the median 12-month target from 3 analysts implies +22.1% from the last close, and Ticker Nerd's factor model ranks Strategic Education, Inc. 95 out of 100 as at 2 Sept 2026. Analyst targets are third-party estimates and frequently wrong; none of this is personal advice.

What is the STRA stock forecast for 2030?

No analyst covering Strategic Education, Inc. publishes a 2030 price target — Wall Street targets run 12 to 18 months out. Sites quoting a 2030 price for STRA are extrapolating price history, which says nothing about the business. The furthest attributed numbers are the current analyst targets: $90 to $105 over the next 12 months.

How has STRA stock performed over the past year?

Strategic Education, Inc. returned +2.0% over the 12 months to 3 Sept 2026, with dividends reinvested. Past performance does not indicate future returns.

What does Strategic Education, Inc. do?

Strategic Education Inc. is an education services company that provides campus-based and online post-secondary learning, along with career-focused training programs for working adults and employers.

What is the latest news on STRA?

The most recent item we track (Zacks Investment Research, 28 Aug 2026): "Why Is Strategic Education (STRA) Up 0.6% Since Last Earnings Report?". Strategic Education (STRA) reported earnings 30 days ago, and its stock has risen 0.6% since that report. The article examines what the earnings result could mean for the company going forward.

Company

About Strategic Education, Inc.

Strategic Education Inc. is an education services company that provides campus-based and online post-secondary learning, along with career-focused training programs for working adults and employers. Its offerings include undergraduate and graduate degree programs in business, education, health services, information technology, criminal justice, and public administration, as well as non-degree courses and professional development pathways. The company operates through U.S. Higher Education, Australia/New Zealand, and Education Technology Services segments, giving it a broad footprint across degree education, skills-based learning, and workforce support. Strategic Education Inc. serves individual learners seeking flexible academic options and organizations that use education benefits and training tools to support employee development. Through brands such as Strayer University, Capella University, Torrens University, Sophia Learning, Workforce Edge, and the Jack Welch Management Institute, the company plays a notable role in the evolving higher education and workforce education market.

CEO Mr. Karl McDonnell · 3,683 employees · United States · https://www.strategiceducation.com