TCRXTCRXHealthcare · Biotechnology

TCRX Stock Forecast: TScan Therapeutics, Inc. Price Predictions for 2026-2027

Last close, 11 Sept 2026
$0.32
+0.75% on the day

The 6 Wall Street analysts covering TScan Therapeutics, Inc. hold a median 12-month price target of $1 — +212.1% from the last close. Ticker Nerd's systematic factor model, run across ~4,600 US stocks, ranks it 51 of 100 as at 12 Sept 2026 — in the upper half.

Market cap
$21.7M
Ticker Nerd rank
51 / 100
Median analyst target
$1.00
Analysts covering
6
Revenue$1.1M−65.8% y/y
Operating income−$30.5M
Net income−$30.4M
Free cash flow−$28.0M
Quarterly, 8 quarters to 30 June 2026 · latest quarter's figure shown
Total return, dividends reinvested
1W
−13.6%
1M
−58.8%
YTD
−68.0%
1Y
−82.7%
From 52W high
−87.3%
From 52W low
+0.8%
$0.32
$2.52
52-week range, adjusted closes · the dot is the last close
Ticker Nerd rank

TCRX stock analysis: one number for the whole business

Consensus tells you what everyone already believes. The model scores TScan Therapeutics, Inc. on its factor families — the same systematic rank behind the Ticker Nerd portfolio.

Where the model ranks itAs at 12 Sept 2026
51 / 100

Percentile across ~4,600 US stocks on Ticker Nerd’s systematic factor model. Higher is better. How the model is built and tested

Growth
98
Size
88
Accruals
64
Revisions
63
Issuance
61
Quality
26
Value
23
Volatility
20
Momentum
7

Growth (98): Sales and profits are climbing, and climbing faster than before.

Momentum (7): The shares have been drifting down relative to others.

Built and run by Aslam Ghouse, an ex-Goldman Sachs quant trader with fourteen years in markets.

Wall Street

TCRX stock forecast 2026-2027: analyst price targets & predictions

The bullish and bearish analyst opinions on TCRX, reported as data — targets and ratings, the market's view beside the model's.

Share price and the analyst range, 12 monthsAdjusted close, US dollars
$0.00$1.00$2.00$3.00$4.00$5.00$6.00Oct 25Jan 26Apr 26Jul 26TCRXHigh $6.00Median $1.00Low $1.00

Price targets and ratings are third-party analyst estimates, reported here as data. They are not Ticker Nerd forecasts, and they are frequently wrong.

Data provided by Twelve Data

What Wall Street says6 analysts
1 Buy5 Hold0 Sell
Low $1.00Median $1.00High $6.00

The green dot is the last close — the median target sits +212.1% from it.

Recent analyst actionsNewest first
DateFirmActionRatingTarget
8 Sept 2026HC Wainwright & Co.DowngradeNeutral$7.00$1.00
3 Sept 2026WedbushDowngradeNeutral$5.00$1.00
2 Sept 2026NeedhamDowngradeHold
12 Aug 2026HC Wainwright & Co.ReiteratesBuy
12 Aug 2026HC Wainwright & Co.ReiteratesBuy$7.00
23 June 2026NeedhamReiteratesBuy
23 June 2026NeedhamReiteratesBuy$6.00
23 June 2026WedbushReiteratesOutperform$5.00
23 June 2026WedbushReiteratesOutperform
5 Mar 2026WedbushMaintainsOutperform
13 Nov 2025HC Wainwright & Co.MaintainsBuy
4 Nov 2025BTIGDowngradeNeutral
4 Nov 2025NeedhamMaintainsBuy
7 May 2025HC Wainwright & Co.MaintainsBuy
8 Apr 2025NeedhamReiteratesBuy
14 Mar 2025Morgan StanleyAssumesOverweight$10
7 Mar 2025BarclaysMaintainsOverweight
6 Mar 2025HC Wainwright & Co.ReiteratesBuy
5 Mar 2025NeedhamMaintainsBuy
11 Dec 2024HC Wainwright & Co.ReiteratesBuy

Price targets and ratings are third-party analyst estimates, reported here as data. They are not Ticker Nerd forecasts, and they are frequently wrong.

Market Radar

This page is one stock. Monday covers all of them.

Computed off the Friday close and sent before the US open.

Market Radar reports the week’s largest rank changes across roughly 4,600 US stocks, the factor behind each one, and where the market went. TCRX appears on the weeks it earns a place.

Free, every Monday. Unsubscribe any time.

Performance

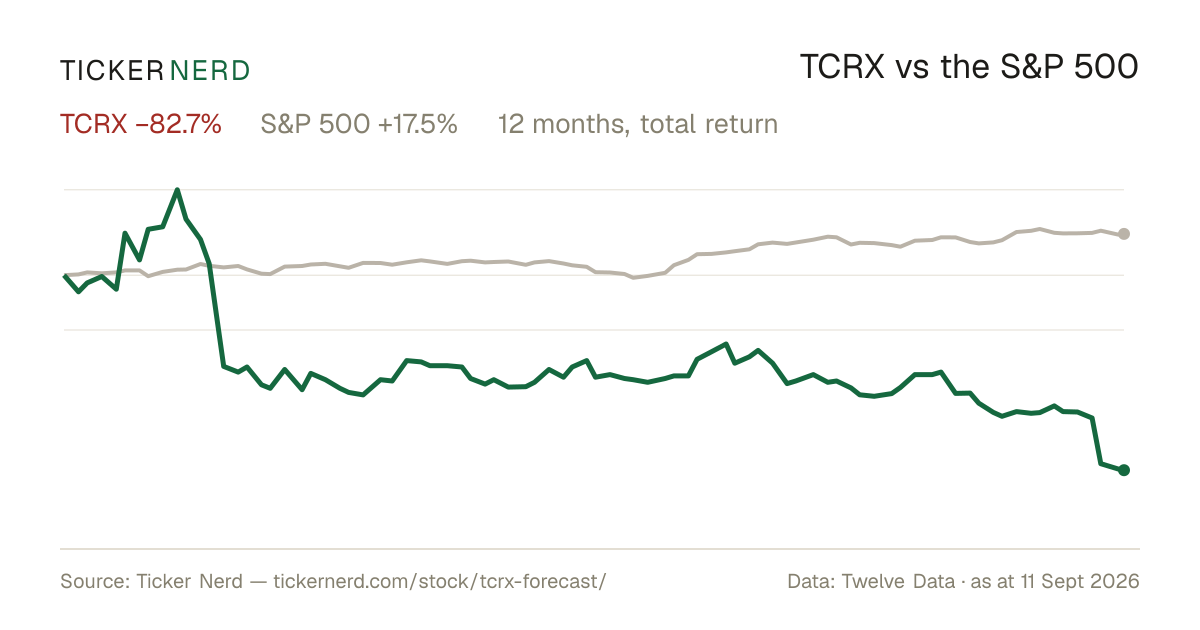
TCRX vs the S&P 500

Both lines are total return — dividends reinvested — so the comparison is honest on both sides.

Over the twelve months to 11 Sept 2026, TScan Therapeutics, Inc. returned −82.7% against +17.5% for the S&P 500, dividends included.

TCRX vs S&P 500, last 12 monthsTotal return, rebased to 100
20406080100120140Oct 25Jan 26Apr 26Jul 26TCRXS&P 500

Download this chart as an image — free to reuse; link this page as the source.

Data provided by Twelve Data

Estimates

TCRX analyst estimate revisions

Not the forecast itself — the direction analysts are revising it. Revision direction is one of the model's factor families.

Which way the estimates are movingNext fiscal year
Analysts raising
1
Analysts cutting
3
Fundamentals

TScan Therapeutics, Inc. (TCRX) financial data

A margin means little on its own. Each bar marks where the figure sits across the whole US universe we score.

Valuation
Trailing P/E
−0.3×

Cheaper than 79% of US stocks

Price / sales
3.1×

Cheaper than 41% of US stocks

Price / book
0.3×

Cheaper than 88% of US stocks

EV / EBITDA
−0.1×

Cheaper than 61% of US stocks

Growth & margins
Revenue growth (YoY)
−65.8%

Higher than 4% of US stocks

Earnings growth (YoY)
−65.8%

Higher than 7% of US stocks

Gross margin
Operating margin
−2901.3%

Higher than 4% of US stocks

Net margin
0.0%

Higher than 30% of US stocks

Returns & dividend
Return on equity
−95.8%

Higher than 14% of US stocks

Return on assets
−31.5%

Higher than 13% of US stocks

Dividend yield

Bars mark the percentile across the ~4,600 US stocks Ticker Nerd covers, among those reporting the figure.

Key statistics

TScan Therapeutics, Inc. (TCRX) statistics: revenue, profit & scale

The headline figures, each with its date. Every row carries its own link — cite it straight from here.

  • TScan Therapeutics, Inc. has a market value of $21.7M and an enterprise value of $12.5M.

  • Revenue in the twelve months to 30 June 2026: $7.1M. The latest quarter shrank 65.8% year on year.

  • Net income over the same four quarters: −$117.7M, a −1655.4% net margin.

  • Diluted earnings per share, trailing twelve months: $−0.91.

  • Free cash flow in the twelve months to 30 June 2026: −$118.4M.

  • TScan Therapeutics, Inc. spent $0.0 on dividends in the twelve months to 30 June 2026.

  • Shares outstanding: 67.8M.

  • Trailing P/E: −0.3×; forward P/E: −0.6× — the forward figure prices analyst consensus estimates, not reported earnings.

  • TScan Therapeutics, Inc. employs 138 people $52K of revenue per employee.

Statement figures: company filings via Twelve Data, four quarters to 30 June 2026 · market figures as at 13 Sept 2026

Data provided by Twelve Data

Peers

TCRX vs competitors

The nearest names by industry and size, scored by the same model — like for like.

Its peer group, ranked by the same modelBiotechnology
CompanyMarket capTKN rank
TCRXTScan Therapeutics, Inc.$21.7M
51
PBMPsyence Biomedical Ltd.$20.6M
4
KRSAKorsana Biosciences, Inc.$21.3M
42
GRDXGridAI Technologies Corp.$20.3M
18
LTRNLantern Pharma, Inc.$21.8M
54
PTNPalatin Technologies, Inc.$20.1M
33
CLRBCellectar Biosciences, Inc.$21.8M
27

Look up any of the roughly 4,600 stocks we score.

The rank is the raw material. Whether the rules would actually own TScan Therapeutics, Inc. — and when they’d sell — is the membership. See the Ticker Nerd 20 →

News

Latest TCRX news & analysis

TScan Therapeutics, Inc. (TCRX) Discusses Strategic Refocus on In Vivo Cell Therapy for Solid Tumors and Pausing of Phase III Heme Study Transcript

Seeking Alpha · 2 Sept 2026neutral

TScan Therapeutics discussed a strategic refocus on in vivo cell therapy for solid tumors and announced the pausing of its Phase III heme study. The discussion, presented as a transcript, outlines this shift in the company's pipeline priorities.

Why it matters — TCRX watchers would care because the company is reallocating its focus away from a late-stage heme program toward in vivo cell therapy for solid tumors, a significant change in strategic direction.

TScan Reorganizes Pipeline Priorities, Implements Workforce Reduction

Benzinga · 2 Sept 2026negative

TScan Therapeutics announced a corporate reorganization to prioritize its in vivo solid tumor pipeline, which includes a workforce reduction of approximately 75%. The restructuring was announced on Wednesday.

Why it matters — A workforce reduction of roughly 75% signals a major strategic shift for TCRX that could affect its operational capacity and near-term execution.

TScan Therapeutics Announces Strategic Reorganization to Focus on in vivo Cell Therapy for Solid Tumors

GlobeNewsWire · 2 Sept 2026negative

TScan Therapeutics announced a strategic reorganization that reduces its workforce by approximately 75% and focuses resources on in vivo cell therapy for solid tumors. The company advances two in vivo-engineered TCR-T candidates to IND-enabling studies with plans for Phase 1 development in Q4 2027, while pausing further enrollment in the Phase 3 ALLOHA-2 study of TSC-101 due to insufficient capital and reporting 100% complete donor chimerism across tracked patients in the ALLOHA study.

Why it matters — A TCRX watcher would care because this significant workforce reduction, pause of the Phase 3 ALLOHA-2 enrollment due to capital constraints, and strategic pivot to belated in vivo solid-tumor programs signal major changes to the company's pipeline and financial runway.

TScan Therapeutics, Inc. (TCRX) Reports Q2 Loss, Misses Revenue Estimates

Zacks Investment Research · 12 Aug 2026neutral

TScan Therapeutics reported a Q2 loss of $0.23 per share, which was narrower than the Zacks Consensus Estimate of a $0.29 loss but compared with a $0.28 per share loss in the same quarter a year ago.

Why it matters — TCRX watchers would note how the company's quarterly results compare with analyst consensus and prior-year performance as a gauge of its financial trajectory.

TScan Therapeutics Reports Second Quarter 2026 Financial Results and Provides Corporate Update

GlobeNewsWire · 12 Aug 2026positive

TScan Therapeutics reported financial results for the three months ended June 30, 2026, and provided a corporate update. The update noted the first patient dosed in the Phase 3 ALLOHA-2 study with a topline readout expected mid-2028, shared positive initial data from Cohort C of the Phase 1 ALLOHA study validating its commercial-ready manufacturing process, and stated cash and cash equivalents fund operations into the second quarter of 2027.

Why it matters — The update provides TCRX watchers with key milestones on the clinical pipeline, manufacturing validation, and cash runway through the second quarter of 2027.

FAQ

Frequently asked questions about TCRX stock

What is the TCRX stock price forecast for 2026-2027?

The 6 Wall Street analysts covering TScan Therapeutics, Inc. have a median 12-month price target of $1, with estimates ranging from $1 to $6. These are third-party analyst estimates, not Ticker Nerd forecasts, and they are frequently wrong.

Is TCRX stock a buy right now?

Of the 6 analysts covering TScan Therapeutics, Inc., 1 rate it a Buy, 5 a Hold and 0 a Sell. Ticker Nerd's systematic factor model ranks TScan Therapeutics, Inc. 51 out of 100 across roughly 4,600 US stocks as at 12 Sept 2026. None of this is personal advice — it does not consider your circumstances.

How does Ticker Nerd's model rank TCRX?

As at 12 Sept 2026, TScan Therapeutics, Inc. ranks 51 out of 100 on Ticker Nerd's systematic factor model — a percentile across roughly 4,600 US stocks, built from its factor families. Its strongest factor family is Growth (98 of 100).

Will TCRX stock go up?

No one can know that. What the data says: the median 12-month target from 6 analysts implies +212.1% from the last close, and Ticker Nerd's factor model ranks TScan Therapeutics, Inc. 51 out of 100 as at 12 Sept 2026. Analyst targets are third-party estimates and frequently wrong; none of this is personal advice.

What is the TCRX stock forecast for 2030?

No analyst covering TScan Therapeutics, Inc. publishes a 2030 price target — Wall Street targets run 12 to 18 months out. Sites quoting a 2030 price for TCRX are extrapolating price history, which says nothing about the business. The furthest attributed numbers are the current analyst targets: $1 to $6 over the next 12 months.

How has TCRX stock performed over the past year?

TScan Therapeutics, Inc. returned -82.7% over the 12 months to 11 Sept 2026, with dividends reinvested. Past performance does not indicate future returns.

What does TScan Therapeutics, Inc. do?

TScan Therapeutics, Inc. is a clinical-stage biotechnology company focused on developing T cell receptor-engineered T cell therapies for cancer.

What is the latest news on TCRX?

The most recent item we track (Seeking Alpha, 2 Sept 2026): "TScan Therapeutics, Inc. (TCRX) Discusses Strategic Refocus on In Vivo Cell Therapy for Solid Tumors and Pausing of Phase III Heme Study Transcript". TScan Therapeutics discussed a strategic refocus on in vivo cell therapy for solid tumors and announced the pausing of its Phase III heme study. The discussion, presented as a transcript, outlines this shift in the company's pipeline priorities.

Company

About TScan Therapeutics, Inc.

TScan Therapeutics, Inc. is a clinical-stage biotechnology company focused on developing T cell receptor-engineered T cell therapies for cancer. The company’s current work centers on TCR-T programs designed to address hematologic malignancies and solid tumors, with lead candidates aimed at eliminating residual disease and reducing relapse risk after allogeneic hematopoietic cell transplantation. TScan Therapeutics also advances multiplexed TCR-T approaches for solid tumors and uses its platform to identify shared tumor antigens and evaluate off-target TCR interactions, supporting the selection of more precise therapeutic targets. Founded in 2018 and headquartered in Waltham, Massachusetts, TScan Therapeutics operates in the immuno-oncology and cell therapy segments of biotechnology, where its pipeline reflects a focus on targeted, personalized cancer treatment development.

CEO Dr. Gavin MacBeath Ph.D. · 138 employees · United States · https://www.tscan.com