TEIndustrials · Electrical Equipment & Parts

TE Stock Forecast: T1 Energy, Inc. Price Predictions for 2026-2027

Last close, 3 Aug 2026
$4.94
+18.47% on the day

The 7 Wall Street analysts covering T1 Energy, Inc. hold a median 12-month price target of $9 — +82.2% from the last close. Ticker Nerd's systematic factor model, run across ~4,600 US stocks, ranks it 38 of 100 as at 1 Aug 2026 — in the lower half. The Street sees upside; the factor read is a caution. That gap is the story on this page.

Market cap
$1.2B
Ticker Nerd rank
38 / 100
Median analyst target
$9.00
Analysts covering
7
Total return, dividends reinvested
1W
+0.8%
1M
−42.3%
YTD
−26.0%
1Y
+325.9%
From 52W high
−59.0%
From 52W low
+298.4%
$1
$12
52-week range, adjusted closes · the dot is the last close
Ticker Nerd rank

TE stock analysis: one number for the whole business

Consensus tells you what everyone already believes. The model scores T1 Energy, Inc. on its factor families — the same systematic rank behind the Ticker Nerd portfolio.

Where the model ranks itAs at 1 Aug 2026
38 / 100

Percentile across ~4,600 US stocks on Ticker Nerd’s systematic factor model. Higher is better. How the model is built and tested

Accruals
99
Momentum
75
Issuance
63
Growth
58
Size
44
Revisions
38
Value
19
Quality
13
Volatility
6

Accruals (99): Reported profit is backed by cash, and the company is not expanding recklessly.

Volatility (6): The share price moves around a lot.

The rank is the raw material. Whether the rules would actually own T1 Energy, Inc. — and when they’d sell — is the membership.

Wall Street

TE stock forecast 2026-2027: analyst price targets & predictions

The bullish and bearish analyst opinions on TE, reported as data — targets and ratings, the market's view beside the model's.

Share price and the analyst range, 12 monthsAdjusted close, US dollars
$0$5$10$15Oct 25Jan 26Apr 26Jul 26TEHigh $16.00Median $9.00Low $7.00

Price targets and ratings are third-party analyst estimates, reported here as data. They are not Ticker Nerd forecasts, and they are frequently wrong.

What Wall Street says7 analysts
6 Buy1 Hold0 Sell
Low $7.00Median $9.00High $16.00

The green dot is the last close — the median target sits +82.2% from it.

Recent analyst actionsNewest first

Of the 20 most recent actions, 3 moved their price target up and 3 moved it down.

DateFirmActionRatingTarget
28 July 2026NeedhamMaintainsBuy$8.00$7.00
17 June 2026BernsteinInitiatesMarket Perform$9.00
17 June 2026BernsteinInitiatesMarket Perform
3 June 2026Northland Capital MarketsInitiatesOutperform
12 May 2026BTIGMaintainsBuy
12 May 2026NeedhamReiteratesBuy
2 Apr 2026NeedhamMaintainsBuy
9 Dec 2025Alliance Global PartnersInitiatesBuy
2 Dec 2025Johnson RiceInitiatesBuy
24 Nov 2025Roth CapitalInitiatesBuy
22 Oct 2025BTIGMaintainsBuy
22 Oct 2025NeedhamInitiatesBuy
8 Sept 2015BMO CapitalMaintainsMarket Perform$27
20 July 2015SunTrust Robinson HumphreyMaintainsNeutral$18$20
17 July 2015MizuhoUpgradeBuy$24
17 July 2015UBSDowngradeNeutral
8 June 2015SunTrust Robinson HumphreyMaintainsNeutral$19$18
14 May 2015Credit AgricoleInitiatesNeutral$19$20
29 Apr 2015BarclaysMaintainsEqual-Weight$22$20
23 Mar 2015SunTrust Robinson HumphreyMaintainsNeutral$19$20

Price targets and ratings are third-party analyst estimates, reported here as data. They are not Ticker Nerd forecasts, and they are frequently wrong.

Estimates

TE analyst estimate revisions

Not the forecast itself — the direction analysts are revising it. Revision direction is one of the model's factor families.

Which way the estimates are movingNext fiscal year
Analysts raising
0
Analysts cutting
1
Fundamentals

T1 Energy, Inc. (TE) financial data

A margin means little on its own. Each bar marks where the figure sits across the whole US universe we score.

Valuation
Trailing P/E
−1.9×

Cheaper than 84% of US stocks

Price / sales
1.3×

Cheaper than 63% of US stocks

Price / book
4.9×

Cheaper than 21% of US stocks

EV / EBITDA
−23.9×

Cheaper than 90% of US stocks

Growth & margins
Revenue growth (YoY)
232.3%

Higher than 97% of US stocks

Earnings growth (YoY)
232.3%

Higher than 92% of US stocks

Gross margin
16.4%

Higher than 17% of US stocks

Operating margin
−12.7%

Higher than 25% of US stocks

Net margin
−42.3%

Higher than 11% of US stocks

Returns & dividend
Return on equity
−111.1%

Higher than 12% of US stocks

Return on assets
−8.0%

Higher than 28% of US stocks

Dividend yield

Bars mark the percentile across the ~4,600 US stocks Ticker Nerd covers, among those reporting the figure.

Peers

TE vs competitors

The nearest names by industry and size, scored by the same model — like for like.

Its peer group, ranked by the same modelElectrical Equipment & Parts
CompanyMarket capTKN rank
TET1 Energy, Inc.$1.2B
38
EOSEEos Energy Enterprises, Inc.$1.2B
12
AMPXAmprius Technologies, Inc.$1.3B
77
ADSEADS-TEC Energy Plc$927.4M
31
ENREnergizer Holdings, Inc.$1.4B
67
ENVXEnovix Corp.$882.7M
15
FCELFuelCell Energy, Inc.$1.7B
55
Market Radar

This page is one stock. Monday covers all of them.

Computed off the Friday close and sent before the US open.

Market Radar reports the week’s largest rank changes across roughly 4,600 US stocks, the factor behind each one, and where the market went. TE appears on the weeks it earns a place.

Free, every Monday. Unsubscribe any time.

News

Latest TE news & analysis

T1 and Clearway Execute Strategic Offtake Deal

GlobeNewsWire · 3 Aug 2026positive

T1 Energy has entered into a contract to supply Clearway Energy Group with 641 megawatts of domestically produced solar cells and modules.

Why it matters — This offtake agreement provides a significant, committed sales channel for T1's domestic solar manufacturing output, supporting production visibility.

T1 Energy Shares Jump as Q2 Sales Beat Estimates, Microsoft AI Capex Lifts Sector

Benzinga · 30 July 2026positive

T1 Energy shares rose following better-than-expected Q2 sales, preliminary financial updates, a major solar intellectual-property deal, and momentum from Microsoft's large AI capex guidance.

Why it matters — The share-price jump, strong sales, and intellectual-property deal signal positive near-term developments for T1 Energy investors to monitor.

T1 Announces Private Placement of Convertible Notes Due 2031

GlobeNewsWire · 30 July 2026neutral

T1 Energy Inc. entered into note purchase agreements for a private offering of $120.0 million in 4.75% convertible senior notes due 2031, with closing expected on July 31, 2026 subject to customary conditions.

Why it matters — This financing raises $120 million in debt capital for T1 Energy, which will affect its capital structure through new convertible notes maturing in 2031.

T1 Announces Preliminary Results for Second Quarter 2026

GlobeNewsWire · 28 July 2026neutral

T1 Energy Inc. announced preliminary financial and operating results for the second quarter of 2026.

Why it matters — The preliminary results provide an early look at T1 Energy's financial and operational performance for the second quarter.

FAQ

Frequently asked questions about TE stock

What is the TE stock price forecast for 2026-2027?

The 7 Wall Street analysts covering T1 Energy, Inc. have a median 12-month price target of $9, with estimates ranging from $7 to $16. These are third-party analyst estimates, not Ticker Nerd forecasts, and they are frequently wrong.

Is TE stock a buy right now?

Of the 7 analysts covering T1 Energy, Inc., 6 rate it a Buy, 1 a Hold and 0 a Sell. Ticker Nerd's systematic factor model ranks T1 Energy, Inc. 38 out of 100 across roughly 4,600 US stocks as at 1 Aug 2026. None of this is personal advice — it does not consider your circumstances.

How does Ticker Nerd's model rank TE?

As at 1 Aug 2026, T1 Energy, Inc. ranks 38 out of 100 on Ticker Nerd's systematic factor model — a percentile across roughly 4,600 US stocks, built from its factor families. Its strongest factor family is Accruals (99 of 100).

Will TE stock go up?

No one can know that. What the data says: the median 12-month target from 7 analysts implies +82.2% from the last close, and Ticker Nerd's factor model ranks T1 Energy, Inc. 38 out of 100 as at 1 Aug 2026. Analyst targets are third-party estimates and frequently wrong; none of this is personal advice.

What is the TE stock forecast for 2030?

No analyst covering T1 Energy, Inc. publishes a 2030 price target — Wall Street targets run 12 to 18 months out. Sites quoting a 2030 price for TE are extrapolating price history, which says nothing about the business. The furthest attributed numbers are the current analyst targets: $7 to $16 over the next 12 months.

How has TE stock performed over the past year?

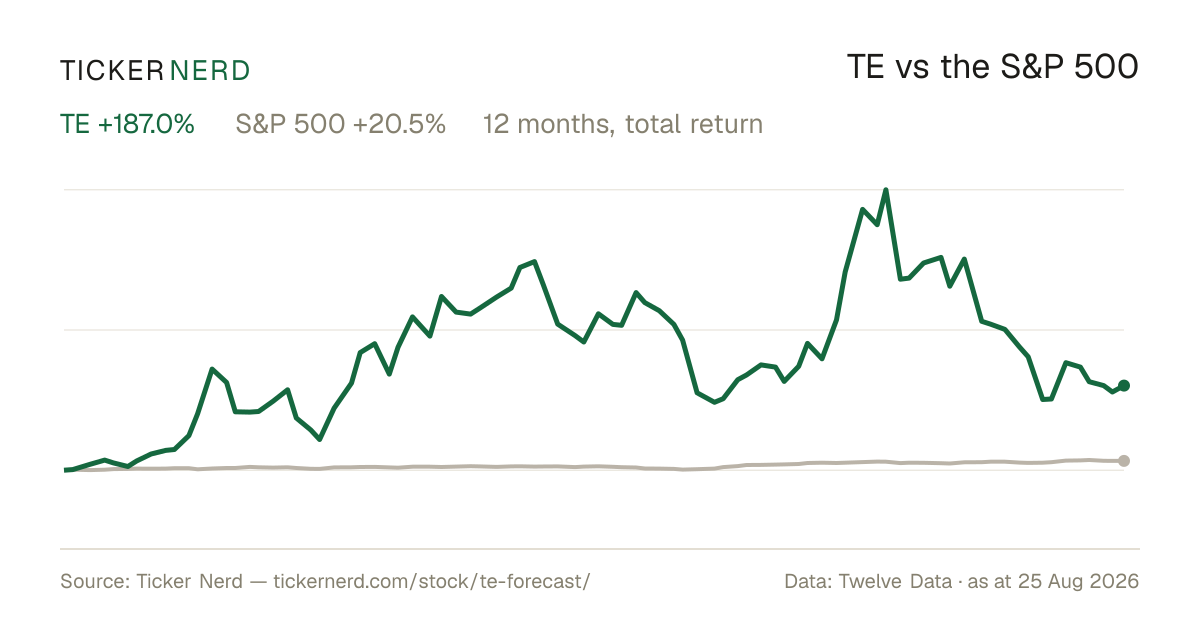
T1 Energy, Inc. returned +325.9% over the 12 months to 3 Aug 2026, with dividends reinvested. Past performance does not indicate future returns.

What does T1 Energy, Inc. do?

T1 Energy Inc. is a solar energy company focused on the manufacturing and sale of photovoltaic modules and solar cells.

What is the latest news on TE?

The most recent item we track (GlobeNewsWire, 3 Aug 2026): "T1 and Clearway Execute Strategic Offtake Deal". T1 Energy has entered into a contract to supply Clearway Energy Group with 641 megawatts of domestically produced solar cells and modules.

Company

About T1 Energy, Inc.

T1 Energy Inc. is a solar energy company focused on the manufacturing and sale of photovoltaic modules and solar cells. The company develops energy solutions centered on building a domestic U.S. solar supply chain, with operations tied to advanced module production and cell fabrication in Texas. Its products use technologies such as PERC and TOPCon to improve solar panel efficiency and support large-scale electricity generation. T1 Energy serves utility-scale developers as well as commercial, industrial, and residential customers, positioning itself across multiple segments of the solar market. Headquartered in Austin, Texas, T1 Energy plays a role in the broader transition toward locally produced renewable energy hardware and infrastructure.

CEO Mr. Daniel Barcelo C.F.A. · 562 employees · United States · https://www.t1energy.com