VERXVERXTechnology · Software - Application

VERX Stock Forecast: Vertex, Inc. Price Predictions for 2026-2027

Last close, 3 Aug 2026
$13
+3.80% on the day

The 15 Wall Street analysts covering Vertex, Inc. hold a median 12-month price target of $16 — +19.4% from the last close. Ticker Nerd's systematic factor model, run across ~4,600 US stocks, ranks it 58 of 100 as at 1 Aug 2026 — in the upper half.

Market cap
$2.1B
Ticker Nerd rank
58 / 100
Median analyst target
$16
Analysts covering
15
Total return, dividends reinvested
1W
+6.0%
1M
+4.3%
YTD
−32.9%
1Y
−58.5%
From 52W high
−59.5%
From 52W low
+26.7%
$11
$33
52-week range, adjusted closes · the dot is the last close
Ticker Nerd rank

VERX stock analysis: one number for the whole business

Consensus tells you what everyone already believes. The model scores Vertex, Inc. on its factor families — the same systematic rank behind the Ticker Nerd portfolio.

Where the model ranks itAs at 1 Aug 2026
58 / 100

Percentile across ~4,600 US stocks on Ticker Nerd’s systematic factor model. Higher is better. How the model is built and tested

Quality
75
Accruals
73
Revisions
68
Volatility
66
Value
61
Issuance
58
Growth
51
Size
35
Momentum
6

Quality (75): The business earns solid, repeatable profits on what it owns.

Momentum (6): The shares have been drifting down relative to others.

The rank is the raw material. Whether the rules would actually own Vertex, Inc. — and when they’d sell — is the membership.

Wall Street

VERX stock forecast 2026-2027: analyst price targets & predictions

The bullish and bearish analyst opinions on VERX, reported as data — targets and ratings, the market's view beside the model's.

Share price and the analyst range, 12 monthsAdjusted close, US dollars
$10$15$20$25$30$35Oct 25Jan 26Apr 26Jul 26VERXHigh $25Median $16Low $14

Price targets and ratings are third-party analyst estimates, reported here as data. They are not Ticker Nerd forecasts, and they are frequently wrong.

What Wall Street says15 analysts
7 Buy8 Hold0 Sell
Low $14Median $16High $25

The green dot is the last close — the median target sits +19.4% from it.

Recent analyst actionsNewest first
DateFirmActionRatingTarget
21 July 2026Morgan StanleyDowngradeEqual-Weight$19$15
29 June 2026TD CowenInitiatesBuy
29 June 2026TD CowenInitiatesBuy$14
8 May 2026CitigroupMaintainsNeutral
7 May 2026Piper SandlerMaintainsNeutral
12 Feb 2026BMO CapitalMaintainsMarket Perform
12 Feb 2026CitigroupMaintainsNeutral
12 Feb 2026CitizensMaintainsMarket Outperform
12 Feb 2026Goldman SachsMaintainsBuy
12 Feb 2026Piper SandlerMaintainsNeutral
11 Feb 2026NeedhamMaintainsBuy
3 Feb 2026Piper SandlerDowngradeNeutral
5 Nov 2025Goldman SachsMaintainsBuy
4 Nov 2025BMO CapitalMaintainsMarket Perform
4 Nov 2025CitizensMaintainsMarket Outperform
4 Nov 2025DA DavidsonMaintainsNeutral
4 Nov 2025NeedhamMaintainsBuy
4 Nov 2025Piper SandlerMaintainsOverweight
4 Nov 2025StifelMaintainsHold
28 Oct 2025CitigroupMaintainsNeutral

Price targets and ratings are third-party analyst estimates, reported here as data. They are not Ticker Nerd forecasts, and they are frequently wrong.

Estimates

VERX analyst estimate revisions

Not the forecast itself — the direction analysts are revising it. Revision direction is one of the model's factor families.

Which way the estimates are movingNext fiscal year
EPS revision, 90 days
+9.3%
Analysts raising
0
Analysts cutting
1
Fundamentals

Vertex, Inc. (VERX) financial data

A margin means little on its own. Each bar marks where the figure sits across the whole US universe we score.

Valuation
Trailing P/E
316.5×

Cheaper than 2% of US stocks

Price / sales
2.7×

Cheaper than 44% of US stocks

Price / book
8.3×

Cheaper than 12% of US stocks

EV / EBITDA
138.4×

Cheaper than 2% of US stocks

Growth & margins
Revenue growth (YoY)
11.1%

Higher than 58% of US stocks

Earnings growth (YoY)
11.1%

Higher than 51% of US stocks

Gross margin
63.5%

Higher than 78% of US stocks

Operating margin
−1.6%

Higher than 33% of US stocks

Net margin
−0.8%

Higher than 29% of US stocks

Returns & dividend
Return on equity
−2.9%

Higher than 41% of US stocks

Return on assets
0.5%

Higher than 46% of US stocks

Dividend yield

Bars mark the percentile across the ~4,600 US stocks Ticker Nerd covers, among those reporting the figure.

Peers

VERX vs competitors

The nearest names by industry and size, scored by the same model — like for like.

Its peer group, ranked by the same modelSoftware - Application
CompanyMarket capTKN rank
VERXVertex, Inc.$2.1B
58
NCNOnCino, Inc.$2.0B
78
KAROKarooooo Ltd.$2.0B
79
BLKBBlackbaud, Inc.$2.0B
95
EVCMEverCommerce, Inc.$2.2B
83
PDFSPDF Solutions, Inc.$1.9B
67
ASANAsana, Inc.$1.9B
94
Market Radar

This page is one stock. Monday covers all of them.

Computed off the Friday close and sent before the US open.

Market Radar reports the week’s largest rank changes across roughly 4,600 US stocks, the factor behind each one, and where the market went. VERX appears on the weeks it earns a place.

Free, every Monday. Unsubscribe any time.

News

Latest VERX news & analysis

Vertex: Solid Recurring Revenue At Great Multiples

Seeking Alpha · 4 Aug 2026positive

Vertex reported a strong Q2 beat and raised guidance, with shares trading near multi-year lows, according to the article. A recent restructuring targets $60–70 million in annual opex savings, and the company reports 105% net retention and 95% gross retention.

Why it matters — A VERX watcher would note the company's high retention rates and recurring revenue resilience in its tax-automation niche, alongside planned operating-cost savings that support profitability.

Vertex Q2 Earnings Call Highlights

MarketBeat · 3 Aug 2026positive

Vertex reported second-quarter revenue at the high end of its guidance range and raised its full-year adjusted EBITDA outlook, citing cost discipline, stable customer retention, and growing demand for e-invoicing solutions.

Why it matters — A VERX watcher would care because the company delivered revenue at the high end of its range and raised its full-year profitability outlook, pointing to solid execution and demand for its tax-technology offerings.

Compared to Estimates, Vertex (VERX) Q2 Earnings: A Look at Key Metrics

Zacks Investment Research · 3 Aug 2026neutral

Zacks Investment Research reported on Vertex's (VERX) Q2 earnings for the period ended June 2026, noting that the headline numbers may be usefully compared against Wall Street estimates and year-ago actuals for key metrics. The article frames these metrics as worth examining for insight into the company's quarterly performance.

Why it matters — A VERX watcher would care because comparing the company's key quarterly metrics to analyst estimates and prior-year results helps gauge how its performance lines up with expectations.

Vertex (VERX) Q2 Earnings and Revenues Top Estimates

Zacks Investment Research · 3 Aug 2026positive

Vertex (VERX) reported second-quarter earnings of $0.20 per share, beating the Zacks Consensus Estimate of $0.19 per share and up from $0.15 per share a year ago. Revenues also topped estimates.

Why it matters — A quarterly earnings beat versus consensus and year-ago levels signals stronger-than-expected financial performance for Vertex.

Vertex Announces Second Quarter 2026 Financial Results

GlobeNewsWire · 3 Aug 2026neutral

Vertex, Inc. announced its financial results for the second quarter ended June 30, 2026. The company, a global indirect tax and compliance provider trading on NASDAQ as VERX, disclosed the results on August 3, 2026.

Why it matters — Quarterly financial results provide VERX watchers with a key update on the company's recent operating performance.

FAQ

Frequently asked questions about VERX stock

What is the VERX stock price forecast for 2026-2027?

The 15 Wall Street analysts covering Vertex, Inc. have a median 12-month price target of $16, with estimates ranging from $14 to $25. These are third-party analyst estimates, not Ticker Nerd forecasts, and they are frequently wrong.

Is VERX stock a buy right now?

Of the 15 analysts covering Vertex, Inc., 7 rate it a Buy, 8 a Hold and 0 a Sell. Ticker Nerd's systematic factor model ranks Vertex, Inc. 58 out of 100 across roughly 4,600 US stocks as at 1 Aug 2026. None of this is personal advice — it does not consider your circumstances.

How does Ticker Nerd's model rank VERX?

As at 1 Aug 2026, Vertex, Inc. ranks 58 out of 100 on Ticker Nerd's systematic factor model — a percentile across roughly 4,600 US stocks, built from its factor families. Its strongest factor family is Quality (75 of 100).

Will VERX stock go up?

No one can know that. What the data says: the median 12-month target from 15 analysts implies +19.4% from the last close, and Ticker Nerd's factor model ranks Vertex, Inc. 58 out of 100 as at 1 Aug 2026. Analyst targets are third-party estimates and frequently wrong; none of this is personal advice.

What is the VERX stock forecast for 2030?

No analyst covering Vertex, Inc. publishes a 2030 price target — Wall Street targets run 12 to 18 months out. Sites quoting a 2030 price for VERX are extrapolating price history, which says nothing about the business. The furthest attributed numbers are the current analyst targets: $14 to $25 over the next 12 months.

How has VERX stock performed over the past year?

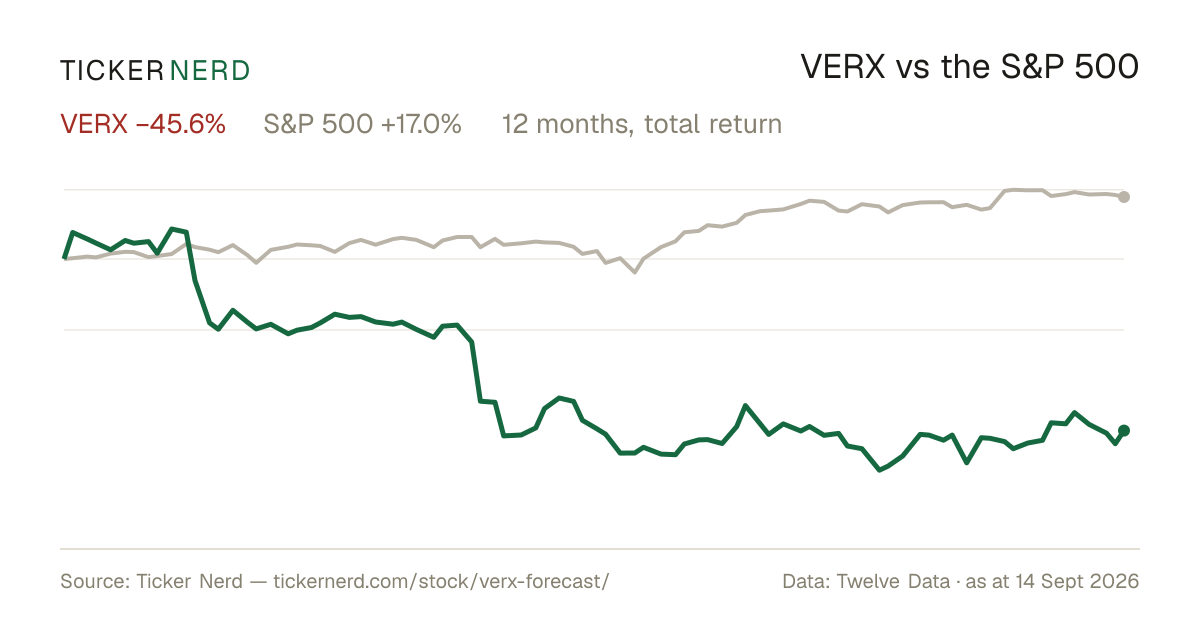
Vertex, Inc. returned -58.5% over the 12 months to 3 Aug 2026, with dividends reinvested. Past performance does not indicate future returns.

What does Vertex, Inc. do?

Vertex Inc. is a leading provider of comprehensive, integrated tax technology software and solutions for enterprise global tax compliance.

What is the latest news on VERX?

The most recent item we track (Seeking Alpha, 4 Aug 2026): "Vertex: Solid Recurring Revenue At Great Multiples". Vertex reported a strong Q2 beat and raised guidance, with shares trading near multi-year lows, according to the article. A recent restructuring targets $60–70 million in annual opex savings, and the company reports 105% net retention and 95% gross retention.

Company

About Vertex, Inc.

Vertex Inc. is a leading provider of comprehensive, integrated tax technology software and solutions for enterprise global tax compliance. The company specializes in automating tax determination, compliance, reporting, data management, document management, analytics, and insights, supporting indirect tax processes across more than 20,000 jurisdictions in over 190 countries. Its platform features tax-sensitized data with extensive rules, real-time integrations with leading ERP, eCommerce, procurement, and financial systems, and tools for e-invoicing, VAT/GST compliance, and audit readiness. Vertex Inc. empowers businesses to handle complex tax scenarios, streamline invoicing, returns filing, and cross-border transactions while adapting to evolving regulations. Serving a diverse range of industries from manufacturing to retail, it embeds tax automation into core operational workflows for accuracy and efficiency. Founded in 1978 and headquartered in King of Prussia, Pennsylvania, Vertex Inc. plays a critical role in enabling continuous compliance and risk reduction in the global financial landscape.

CEO Mr. Christopher David Young · 2,100 employees · United States · https://www.vertexinc.com