WYNNWYNNConsumer Cyclical · Resorts & Casinos

WYNN Stock Forecast: Wynn Resorts Ltd. Price Predictions for 2026-2027

Last close, 14 Aug 2026
$103
+0.40% on the day

The 20 Wall Street analysts covering Wynn Resorts Ltd. hold a median 12-month price target of $134 — +30.7% from the last close. Ticker Nerd's systematic factor model, run across ~4,600 US stocks, ranks it 63 of 100 as at 15 Aug 2026 — in the upper half.

Market cap
$10.6B
Ticker Nerd rank
63 / 100
Median analyst target
$134
Analysts covering
20
Total return, dividends reinvested
1W
+0.2%
1M
+7.2%
YTD
−14.2%
1Y
−6.9%
From 52W high
−22.4%
From 52W low
+8.9%
$94
$132
52-week range, adjusted closes · the dot is the last close
Ticker Nerd rank

WYNN stock analysis: one number for the whole business

Consensus tells you what everyone already believes. The model scores Wynn Resorts Ltd. on its factor families — the same systematic rank behind the Ticker Nerd portfolio.

Where the model ranks itAs at 15 Aug 2026
63 / 100

Percentile across ~4,600 US stocks on Ticker Nerd’s systematic factor model. Higher is better. How the model is built and tested

Value
79
Growth
70
Accruals
69
Issuance
65
Volatility
64
Quality
62
Revisions
51
Momentum
41
Size
15

Value (79): The shares cost little relative to the profits and assets behind them — which can mean the market is too gloomy, or that the business really is in trouble.

Momentum (41): The shares have been drifting down relative to others.

Size (15): Larger than most of the companies we track — more scrutinised, less often mispriced.

Built and run by Aslam Ghouse, an ex-Goldman Sachs quant trader with fourteen years in markets.

Wall Street

WYNN stock forecast 2026-2027: analyst price targets & predictions

The bullish and bearish analyst opinions on WYNN, reported as data — targets and ratings, the market's view beside the model's.

Share price and the analyst range, 12 monthsAdjusted close, US dollars
$90$100$110$120$130$140$150Oct 25Jan 26Apr 26Jul 26WYNNHigh $145Median $134Low $116

Price targets and ratings are third-party analyst estimates, reported here as data. They are not Ticker Nerd forecasts, and they are frequently wrong.

What Wall Street says20 analysts
20 Buy0 Hold0 Sell
Low $116Median $134High $145

The green dot is the last close — the median target sits +30.7% from it.

Recent analyst actionsNewest first

Of the 20 most recent actions, 2 moved their price target up and 7 moved it down.

DateFirmActionRatingTarget
6 Aug 2026Argus ResearchMaintainsBuy$115$130
5 Aug 2026BarclaysMaintainsOverweight$134$136
5 Aug 2026MacquarieMaintainsOutperform$143
5 Aug 2026Wells FargoMaintainsOverweight$141$131
28 July 2026MizuhoMaintainsOutperform
28 July 2026MizuhoMaintainsOutperform$133$125
16 July 2026StifelMaintainsBuy$150$140
16 July 2026StifelMaintainsBuy
15 July 2026JP MorganMaintainsOverweight$135$134
15 July 2026JP MorganMaintainsOverweight
14 July 2026Wells FargoMaintainsOverweight$142$141
14 July 2026Wells FargoMaintainsOverweight
9 July 2026BarclaysMaintainsOverweight$139$134
9 July 2026BarclaysMaintainsOverweight
8 July 2026Truist SecuritiesInitiatesBuy
8 July 2026Truist SecuritiesInitiatesBuy$125
7 July 2026MacquarieMaintainsOutperform
7 July 2026MacquarieMaintainsOutperform$145$143
19 May 2026MacquarieMaintainsOutperform
14 May 2026Morgan StanleyMaintainsOverweight

Price targets and ratings are third-party analyst estimates, reported here as data. They are not Ticker Nerd forecasts, and they are frequently wrong.

Market Radar

This page is one stock. Monday covers all of them.

Computed off the Friday close and sent before the US open.

Market Radar reports the week’s largest rank changes across roughly 4,600 US stocks, the factor behind each one, and where the market went. WYNN appears on the weeks it earns a place.

Free, every Monday. Unsubscribe any time.

Estimates

WYNN analyst estimate revisions

Not the forecast itself — the direction analysts are revising it. Revision direction is one of the model's factor families.

Which way the estimates are movingNext fiscal year
EPS revision, 90 days
−1.5%
Analysts raising
1
Analysts cutting
8
Fundamentals

Wynn Resorts Ltd. (WYNN) financial data

A margin means little on its own. Each bar marks where the figure sits across the whole US universe we score.

Valuation
Trailing P/E
24.6×

Cheaper than 33% of US stocks

Price / sales
1.4×

Cheaper than 62% of US stocks

Price / book
−11.6×

Cheaper than 98% of US stocks

EV / EBITDA
11.0×

Cheaper than 36% of US stocks

Growth & margins
Revenue growth (YoY)
6.9%

Higher than 44% of US stocks

Earnings growth (YoY)
111.5%

Higher than 86% of US stocks

Gross margin
40.9%

Higher than 51% of US stocks

Operating margin
16.5%

Higher than 74% of US stocks

Net margin
6.1%

Higher than 62% of US stocks

Returns & dividend
Return on equity
−31.7%

Higher than 26% of US stocks

Return on assets
5.7%

Higher than 80% of US stocks

Dividend yield
1.0%

Higher than 23% of US dividend payers

Bars mark the percentile across the ~4,600 US stocks Ticker Nerd covers, among those reporting the figure.

Peers

WYNN vs competitors

The nearest names by industry and size, scored by the same model — like for like.

Its peer group, ranked by the same modelResorts & Casinos
CompanyMarket capTKN rank
WYNNWynn Resorts Ltd.$10.6B
63
MGMMGM Resorts International$11.3B
66
RRRRed Rock Resorts, Inc.$6.7B
53
BYDBoyd Gaming Corp.$6.1B
78
CZRCaesars Entertainment, Inc.$6.1B
52
MTNVail Resorts, Inc.$5.3B
42
VACMarriott Vacations Worldwide Corp.$4.2B
64

Look up any of the roughly 4,600 stocks we score.

The rank is the raw material. Whether the rules would actually own Wynn Resorts Ltd. — and when they’d sell — is the membership. See the Ticker Nerd 20 →

News

Latest WYNN news & analysis

Is Wynn Resorts Stock a Buy as Macau Growth Meets Rising Capex Risks?

Zacks Investment Research · 11 Aug 2026negative

A Zacks Investment Research piece examines Wynn Resorts stock amid Macau growth and a valuation discount, while flagging rising capital expenditure, weaker U.S. margins, and greater cash-flow risk as offsetting concerns.

Why it matters — Wynn watchers would care because the report highlights growing capex and cash-flow pressures that could temper the benefits of Macau's growth and the stock's valuation discount.

WYNN's Q2 Beat Puts Macau Strength and Margin Pressure in Focus

Zacks Investment Research · 11 Aug 2026neutral

Wynn Resorts reported a Q2 earnings beat that was driven by strength in Macau, according to Zacks Investment Research. However, the results were offset by weaker U.S. margins and higher costs associated with its UAE project, which add pressure.

Why it matters — A WYNN watcher would care because the Q2 beat highlights Macau as a key growth driver while U.S. margin weakness and rising UAE project costs introduce new cost pressures on the company's results.

Wynn Resorts: Slow In Las Vegas, Strong In Macau

Seeking Alpha · 6 Aug 2026positive

Wynn Resorts reported overall good Q2 results, with subdued performance in Las Vegas due to slow tourism but strong results in Macau despite a market hiccup. The company is also planning significant capital expenditures in 2026-2027 at Wynn Al Marjan and Wynn Palace, which it expects to bolster earnings in coming years.

Why it matters — Wynn watchers would care because the results highlight contrasting regional performance in Las Vegas and Macau, while upcoming large-capital-expenditure projects signal the company's forward investment plans.

Wynn Resorts Q2 Earnings & Revenues Beat on Palace Strength

Zacks Investment Research · 5 Aug 2026positive

Wynn Resorts reported second-quarter earnings and revenues that surpassed analyst estimates and increased year over year, driven by a 21.1% revenue jump at Wynn Palace.

Why it matters — The strong performance at Wynn Palace, a key property, was the primary driver of WYNN's better-than-expected quarterly results.

Wynn Resorts reports higher earnings and revenue for Q2 as operations improve

Proactive Investors · 5 Aug 2026positive

Wynn Resorts reported higher second-quarter earnings and revenue that exceeded Wall Street expectations, supported by improved operations and profitability. Following the results, the company's shares climbed about 7%.

Why it matters — A WYNN watcher would care because the company beat analyst estimates on higher revenue and improved profitability, signaling strengthening operational performance.

FAQ

Frequently asked questions about WYNN stock

What is the WYNN stock price forecast for 2026-2027?

The 20 Wall Street analysts covering Wynn Resorts Ltd. have a median 12-month price target of $134, with estimates ranging from $116 to $145. These are third-party analyst estimates, not Ticker Nerd forecasts, and they are frequently wrong.

Is WYNN stock a buy right now?

Of the 20 analysts covering Wynn Resorts Ltd., 20 rate it a Buy, 0 a Hold and 0 a Sell. Ticker Nerd's systematic factor model ranks Wynn Resorts Ltd. 63 out of 100 across roughly 4,600 US stocks as at 15 Aug 2026. None of this is personal advice — it does not consider your circumstances.

How does Ticker Nerd's model rank WYNN?

As at 15 Aug 2026, Wynn Resorts Ltd. ranks 63 out of 100 on Ticker Nerd's systematic factor model — a percentile across roughly 4,600 US stocks, built from its factor families. Its strongest factor family is Value (79 of 100).

Will WYNN stock go up?

No one can know that. What the data says: the median 12-month target from 20 analysts implies +30.7% from the last close, and Ticker Nerd's factor model ranks Wynn Resorts Ltd. 63 out of 100 as at 15 Aug 2026. Analyst targets are third-party estimates and frequently wrong; none of this is personal advice.

What is the WYNN stock forecast for 2030?

No analyst covering Wynn Resorts Ltd. publishes a 2030 price target — Wall Street targets run 12 to 18 months out. Sites quoting a 2030 price for WYNN are extrapolating price history, which says nothing about the business. The furthest attributed numbers are the current analyst targets: $116 to $145 over the next 12 months.

How has WYNN stock performed over the past year?

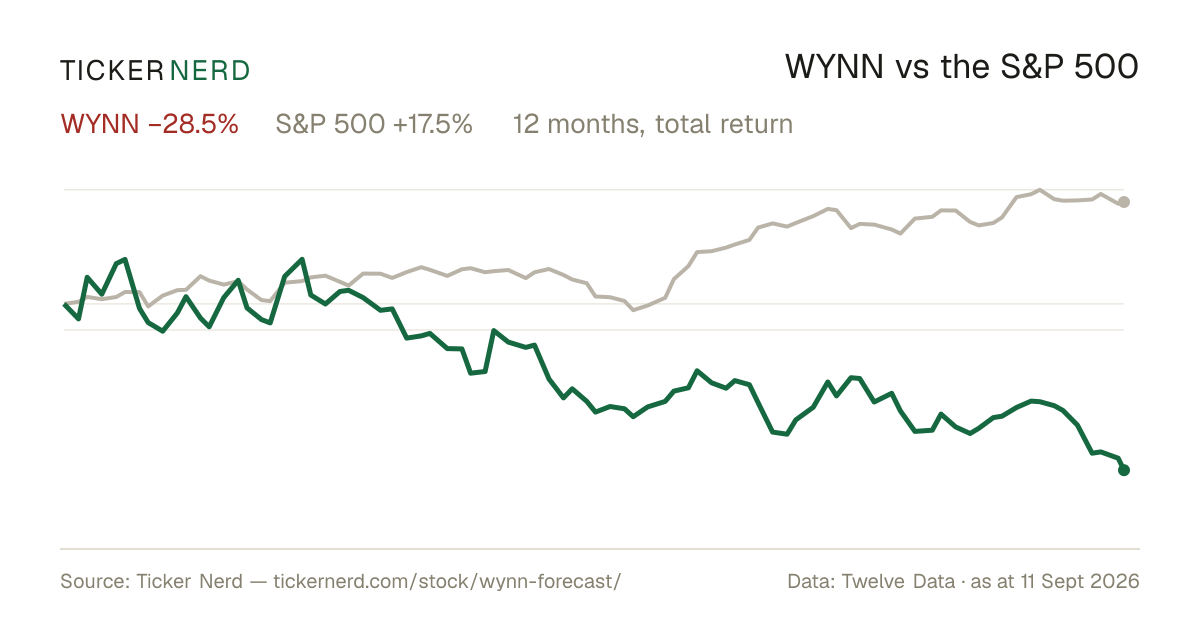
Wynn Resorts Ltd. returned -6.9% over the 12 months to 14 Aug 2026, with dividends reinvested. Past performance does not indicate future returns.

What does Wynn Resorts Ltd. do?

Wynn Resorts, Limited is a casino resorts operator that designs, develops, owns, and operates luxury destination properties. Its portfolio includes Wynn Las Vegas, Encore Boston Harbor, Wynn Macau, and Wynn Palace, along with associated hotel accommodations, gaming floors, fine dining, premium retail, entertainment venues, and large meeting spaces.

What is the latest news on WYNN?

The most recent item we track (Zacks Investment Research, 11 Aug 2026): "Is Wynn Resorts Stock a Buy as Macau Growth Meets Rising Capex Risks?". A Zacks Investment Research piece examines Wynn Resorts stock amid Macau growth and a valuation discount, while flagging rising capital expenditure, weaker U.S. margins, and greater cash-flow risk as offsetting concerns.

Company

About Wynn Resorts Ltd.

Wynn Resorts, Limited is a casino resorts operator that designs, develops, owns, and operates luxury destination properties. Its portfolio includes Wynn Las Vegas, Encore Boston Harbor, Wynn Macau, and Wynn Palace, along with associated hotel accommodations, gaming floors, fine dining, premium retail, entertainment venues, and large meeting spaces. The company serves leisure travelers, convention guests, and gaming customers across major resort markets in the United States and Macau. Wynn Resorts also operates digital sports betting and iGaming services in selected markets, adding a complementary online component to its resort-focused business. Headquartered in Las Vegas, Nevada, Wynn Resorts is recognized for its upscale integrated resort model that combines hospitality, gaming, dining, and entertainment under one brand.

CEO Mr. Craig Scott Billings · 28,500 employees · United States · https://www.wynnresorts.com