XEIndustrials · Specialty Industrial Machinery

XE Stock Forecast: X-Energy, Inc. Price Predictions for 2026-2027

Last close, 8 Oct 2026
$14
−4.31% on the day

The 9 Wall Street analysts covering X-Energy, Inc. hold a median 12-month price target of $37 — +165.1% from the last close. Ticker Nerd's systematic factor model, run across ~4,600 US stocks, ranks it 0 of 100 as at 8 Oct 2026 — in the weakest quartile. The Street sees upside; the factor read is a caution. That gap is the story on this page.

Market cap
$5.8B
Ticker Nerd rank
0 / 100
Median analyst target
$37
Analysts covering
9
Revenue$50.1M
Operating income−$110.0M
Net income−$105.3M
Free cash flow−$160.6M
Quarterly, 4 quarters to 30 June 2026 · latest quarter's figure shown
Total return, dividends reinvested
1W
−1.3%
1M
−28.1%
From high
−61.7%
From low
0.0%
$14
$36
Range since 24 Apr 2026, adjusted closes · the dot is the last close
Ticker Nerd rank

XE stock analysis: one number for the whole business

Consensus tells you what everyone already believes. The model scores X-Energy, Inc. on its factor families — the same systematic rank behind the Ticker Nerd portfolio.

Where the model ranks itAs at 8 Oct 2026
0 / 100

Percentile across ~4,600 US stocks on Ticker Nerd’s systematic factor model. Higher is better. How the model is built and tested

Revisions
34
Size
21
Issuance
10
Accruals
8
Growth
5
Value
4
Volatility
3
Quality
1
Momentum
1

Revisions (34): Analysts have, on balance, been raising their forecasts.

Momentum (1): The shares have been drifting down relative to others.

Built and run by Aslam Ghouse, an ex-Goldman Sachs quant trader with fourteen years in markets.

Wall Street

XE stock forecast 2026-2027: analyst price targets & predictions

The bullish and bearish analyst opinions on XE, reported as data — targets and ratings, the market's view beside the model's.

Share price and the analyst range, since 24 Apr 2026Adjusted close, US dollars
$10$20$30$40$50$60May 26Jun 26Jul 26Aug 26Sep 26Oct 26XEHigh $57Median $37Low $9

Price targets and ratings are third-party analyst estimates, reported here as data. They are not Ticker Nerd forecasts, and they are frequently wrong.

Data provided by Twelve Data

What Wall Street says9 analysts
6 Buy2 Hold1 Sell
Low $9Median $37High $57

The green dot is the last close — the median target sits +165.1% from it.

Recent analyst actionsNewest first
DateFirmActionRatingTarget
9 Sept 2026Piper SandlerInitiatesUnderweight$9.00
8 Sept 2026GuggenheimReiteratesBuy$57
14 Aug 2026Cantor FitzgeraldReiteratesOverweight$38
14 Aug 2026Cantor FitzgeraldReiteratesOverweight—
1 July 2026UBSMaintainsBuy$40 → $34
1 July 2026UBSMaintainsBuy—
20 May 2026Cantor FitzgeraldInitiatesOverweight—
19 May 2026GuggenheimInitiatesBuy—
19 May 2026JefferiesInitiatesHold—
19 May 2026JP MorganInitiatesOverweight—
19 May 2026Morgan StanleyInitiatesOverweight—
19 May 2026TD CowenInitiatesBuy—
19 May 2026UBSInitiatesBuy—
19 May 2026Wolfe ResearchInitiatesPeer Perform—

Price targets and ratings are third-party analyst estimates, reported here as data. They are not Ticker Nerd forecasts, and they are frequently wrong.

Market Radar

This page is one stock. Monday covers all of them.

Computed off the Friday close and sent before the US open.

Market Radar reports the week’s largest rank changes across roughly 4,600 US stocks, the factor behind each one, and where the market went. XE appears on the weeks it earns a place.

Free, every Monday. Unsubscribe any time.

Performance

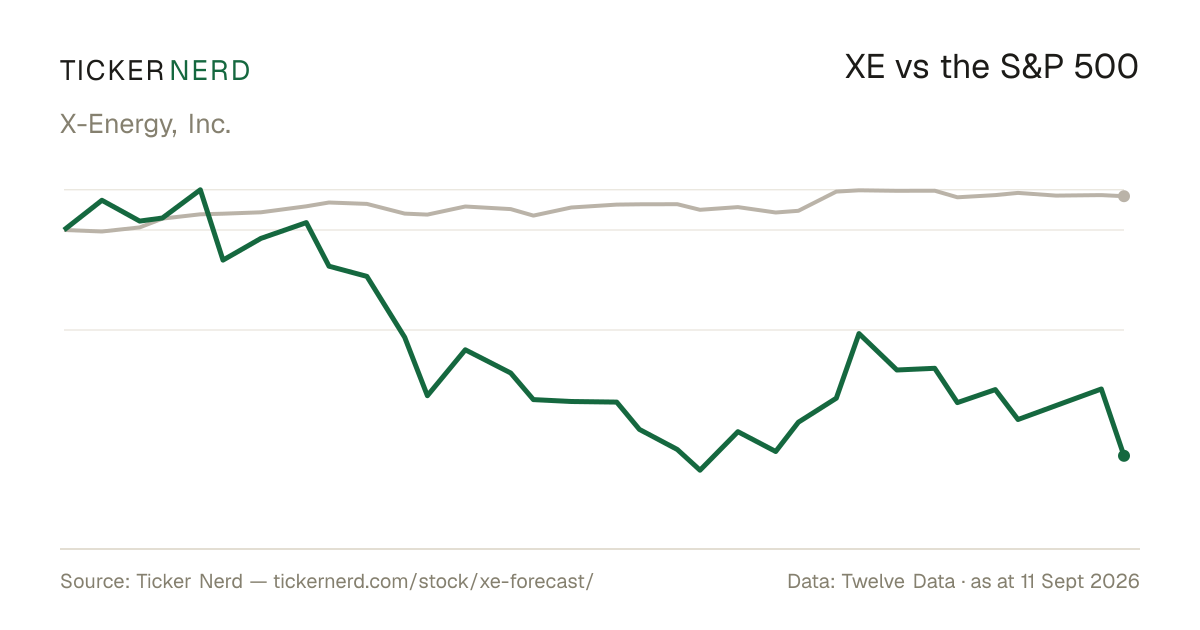
XE vs the S&P 500

Both lines are total return — dividends reinvested — so the comparison is honest on both sides.

XE vs S&P 500, last 12 monthsTotal return, rebased to 100
406080100120May 26Jun 26Jul 26Aug 26Sep 26Oct 26XES&P 500

Download this chart as an image — free to reuse; link this page as the source.

Data provided by Twelve Data

Estimates

XE analyst estimate revisions

Not the forecast itself — the direction analysts are revising it. Revision direction is one of the model's factor families.

Which way the estimates are movingNext fiscal year
Analysts raising
0
Analysts cutting
2
Fundamentals

X-Energy, Inc. (XE) financial data

A margin means little on its own. Each bar marks where the figure sits across the whole US universe we score.

Valuation
Trailing P/E
−26.1×

Cheaper than 97% of US stocks

Price / sales
38.9×

Cheaper than 6% of US stocks

Price / book
2.3×

Cheaper than 40% of US stocks

EV / EBITDA
−11.3×

Cheaper than 85% of US stocks

Growth & margins
Revenue growth (YoY)
196.2%

Higher than 96% of US stocks

Earnings growth (YoY)
—
Gross margin
−72.9%

Higher than 2% of US stocks

Operating margin
−219.5%

Higher than 10% of US stocks

Net margin
−298.7%

Higher than 1% of US stocks

Returns & dividend
Return on equity
−6.9%

Higher than 38% of US stocks

Return on assets
−6.6%

Higher than 30% of US stocks

Dividend yield
0.0%

Higher than 1% of US dividend payers

Bars mark the percentile across the ~4,600 US stocks Ticker Nerd covers, among those reporting the figure.

Key statistics

X-Energy, Inc. (XE) statistics: revenue, profit & scale

The headline figures, each with its date. Every row carries its own link — cite it straight from here.

  • X-Energy, Inc. has a market value of $5.8B and an enterprise value of $3.1B.

  • Revenue in the twelve months to 30 June 2026: $124.0M. The latest quarter grew 196.2% year on year.

  • Net income over the same four quarters: −$370.6M, a −298.8% net margin.

  • Diluted earnings per share, trailing twelve months: $−0.86.

  • Free cash flow in the twelve months to 30 June 2026: −$368.3M, after $141.9M of capital spending.

  • X-Energy, Inc. spent $2.5M on share buybacks in the twelve months to 30 June 2026.

  • Shares outstanding: 406.4M.

  • Trailing P/E: −26.1×; forward P/E: −26.2× — the forward figure prices analyst consensus estimates, not reported earnings.

  • Forward dividend yield: 0.00%, paying out 0% of earnings.

  • X-Energy, Inc. employs 889 people — $140K of revenue per employee.

Statement figures: company filings via Twelve Data, four quarters to 30 June 2026 · market figures as at 8 Oct 2026

Data provided by Twelve Data

Peers

XE vs competitors

The nearest names by industry and size, scored by the same model — like for like.

Its peer group, ranked by the same modelSpecialty Industrial Machinery
CompanyMarket capTKN rank
XEX-Energy, Inc.$5.8B
0
JBTMJBT Marel Corp.$5.5B
64
MIDDThe Middleby Corp.$5.0B
67
NPOEnpro, Inc.$6.5B
60
CSWCSW Industrials, Inc.$4.7B
48
GTESGates Industrial Corp. Ltd.$6.8B
96
FELEFranklin Electric Co., Inc.$4.3B
93

Look up any of the roughly 4,600 stocks we score.

The rank is the raw material. Whether the rules would actually own X-Energy, Inc. — and when they’d sell — is the membership. See the Ticker Nerd 20 →

News

Latest XE news & analysis

Cedar Grove Capital Q3 2026 Portfolio Update

Seeking Alpha · 7 Oct 2026neutral

Cedar Grove Capital’s Q3 2026 update says it closed its short position in X-Energy Inc. during the quarter.

Why it matters — The update reports a change in one investor’s position in XE.

X-Energy: The Sell-Off Has Changed The Investment Case

Seeking Alpha · 5 Oct 2026positive

Seeking Alpha reiterates a speculative Buy on X-Energy at $14.30 with improved conviction, citing tangible progress in project development and pipeline credibility. The article notes weak near-term financials but highlights a robust $1.9 billion cash position that supports multi-year commercialization efforts and mitigates liquidity risk, while singling out the Dow project's permitting and construction as pivotal to validating the 11.5 GW pipeline.

Why it matters — XE watchers would care because the piece identifies the Dow project's execution as the key near-term catalyst that could de-risk the company's large pipeline and underpin its long-term growth thesis.

X-Energy Just Went Public in 2026. Here's How It Stacks Up Against Oklo, NuScale, and BWX Technologies.

The Motley Fool · 1 Oct 2026negative

X-Energy went public in 2026, and its stock has fallen nearly 40% below its IPO price. The article compares the company against nuclear peers Oklo, NuScale, and BWX Technologies, noting the company has much to prove and its stock does not yet appear to be a bargain.

Why it matters — X-Energy watchers would care because the stock's steep post-IPO decline and the company's positioning relative to established nuclear peers signal potential challenges in proving its value to the market.

New Industry Survey Reinforces Nuclear's Growth Outlook

ETF Trends · 28 Sept 2026positive

A new survey from the Nuclear Energy Institute of U.S. utility companies indicates growing interest in new reactors and expectations that commercial reactors will operate beyond 80 years. The findings point to planning for a larger and longer-lasting nuclear fleet in the U.S.

Why it matters — For a X-Energy watcher, the survey signals an industry outlook of expanding reactor development and extended operational lifespans, which could support demand for advanced nuclear technology.

X-Energy vs. GE Vernova: Is the New IPO the Better Buy?

The Motley Fool · 28 Sept 2026neutral

The article compares newly public X-Energy with the established industrial firm GE Vernova, noting that both companies develop small modular nuclear reactors. It highlights GE Vernova's sizable $176 billion backlog as a contrast to X-Energy's newer IPO status.

Why it matters — The comparison frames X-Energy's position against an established nuclear reactor competitor, giving XE watchers context for how the new IPO stacks up in the small modular reactor market.

FAQ

Frequently asked questions about XE stock

What is the XE stock price forecast for 2026-2027?

The 9 Wall Street analysts covering X-Energy, Inc. have a median 12-month price target of $37, with estimates ranging from $9 to $57. These are third-party analyst estimates, not Ticker Nerd forecasts, and they are frequently wrong.

Is XE stock a buy right now?

Of the 9 analysts covering X-Energy, Inc., 6 rate it a Buy, 2 a Hold and 1 a Sell. Ticker Nerd's systematic factor model ranks X-Energy, Inc. 0 out of 100 across roughly 4,600 US stocks as at 8 Oct 2026. None of this is personal advice — it does not consider your circumstances.

How does Ticker Nerd's model rank XE?

As at 8 Oct 2026, X-Energy, Inc. ranks 0 out of 100 on Ticker Nerd's systematic factor model — a percentile across roughly 4,600 US stocks, built from its factor families. Its strongest factor family is Revisions (34 of 100).

Will XE stock go up?

No one can know that. What the data says: the median 12-month target from 9 analysts implies +165.1% from the last close, and Ticker Nerd's factor model ranks X-Energy, Inc. 0 out of 100 as at 8 Oct 2026. Analyst targets are third-party estimates and frequently wrong; none of this is personal advice.

What is the XE stock forecast for 2030?

No analyst covering X-Energy, Inc. publishes a 2030 price target — Wall Street targets run 12 to 18 months out. Sites quoting a 2030 price for XE are extrapolating price history, which says nothing about the business. The furthest attributed numbers are the current analyst targets: $9 to $57 over the next 12 months.

What does X-Energy, Inc. do?

X-Energy, Inc. Class A Common Stock represents ownership in X-Energy, Inc., a developer of advanced nuclear reactor and fuel technology focused on clean energy generation.

What is the latest news on XE?

The most recent item we track (Seeking Alpha, 7 Oct 2026): "Cedar Grove Capital Q3 2026 Portfolio Update". Cedar Grove Capital’s Q3 2026 update says it closed its short position in X-Energy Inc. during the quarter.

Company

About X-Energy, Inc.

X-Energy, Inc. Class A Common Stock represents ownership in X-Energy, Inc., a developer of advanced nuclear reactor and fuel technology focused on clean energy generation. The company’s current business centers on small modular reactor systems and proprietary nuclear fuel solutions, including the Xe-100 reactor and TRISO-X fuel. These offerings are designed for power producers and industrial customers seeking reliable, scalable nuclear energy solutions with applications in electricity generation and process heat. X-Energy, Inc. operates in the advanced nuclear sector, where its products address growing interest in low-carbon baseload power and specialized energy infrastructure. Headquartered in Rockville, Maryland, the company serves as a technology-focused participant in the broader energy market through its reactor design and fuel manufacturing capabilities.

CEO Mr. J. Clay Sell · 889 employees · United States · https://www.x-energy.com