ADCTADCTHealthcare · Drug Manufacturers - Specialty & Generic

ADCT Stock Forecast: ADC Therapeutics SA Price Predictions for 2026-2027

Last close, 18 Nov 2026
$1.37
+1.48% on the day

The 5 Wall Street analysts covering ADC Therapeutics SA hold a median 12-month price target of $3 — +119.0% from the last close. Ticker Nerd's systematic factor model, run across ~4,600 US stocks, ranks it 86 of 100 as at 17 Nov 2026 — inside the top quartile. Here, the model and the Street point the same way.

Market cap
$189.9M
Ticker Nerd rank
86/ 100
Median analyst target
$3.00
Analysts covering
5
Revenue$19.2M+2.2% y/y
Operating income−$22.8M
Net income−$16.6M
Free cash flow−$11.8M
Quarterly, 8 quarters to 30 June 2026 · latest quarter's figure shown
Total return, dividends reinvested
1W
−14.4%
1M
−2.1%
YTD
−61.2%
1Y
−65.8%
From 52W high
−71.9%
From 52W low
+42.7%
$0.96
$4.88
52-week range, adjusted closes · the dot is the last close
Ticker Nerd rank

ADCT stock analysis: one number for the whole business

Consensus tells you what everyone already believes. The model scores ADC Therapeutics SA on its factor families — the same systematic rank behind the Ticker Nerd portfolio.

Where the model ranks itAs at 17 Nov 2026
86/ 100

Percentile across ~4,600 US stocks on Ticker Nerd’s systematic factor model. Higher is better. How the model is built and tested

Growth
94
Revisions
85
Issuance
75
Quality
75
Value
72
Size
66
Accruals
62
Volatility
18
Momentum
14

Growth (94): Sales and profits are climbing, and climbing faster than before.

Momentum (14): The shares have been drifting down relative to others.

Built and run by Aslam Ghouse, an ex-Goldman Sachs systematic trader with 15+ years in markets.

Wall Street

ADCT stock forecast 2026-2027: analyst price targets & predictions

The bullish and bearish analyst opinions on ADCT, reported as data — targets and ratings, the market's view beside the model's.

Share price and the analyst range, 12 monthsAdjusted close, US dollars
$1.00$2.00$3.00$4.00$5.00Jan 26Apr 26Jul 26Oct 26ADCTHigh $5.00Median $3.00Low $2.00

Price targets and ratings are third-party analyst estimates, reported here as data. They are not Ticker Nerd forecasts, and they are frequently wrong.

Data provided by Twelve Data

What Wall Street says5 analysts
3 Buy2 Hold0 Sell
Low $2.00Median $3.00High $5.00

The green dot is the last close — the median target sits +119.0% from it.

Recent analyst actionsNewest first
DateFirmActionRatingTarget
17 Aug 2026GuggenheimMaintainsBuy$10 → $5.00
8 June 2026HC Wainwright & Co.DowngradeNeutral—
4 June 2026RBC CapitalDowngradeSector Perform—
4 June 2026RBC CapitalDowngradeSector Perform$6.00 → $2.00
5 May 2026HC Wainwright & Co.ReiteratesBuy—
5 May 2026RBC CapitalReiteratesOutperform—
23 Mar 2026HC Wainwright & Co.MaintainsBuy—
16 Oct 2025HC Wainwright & Co.MaintainsBuy—
13 Aug 2025GuggenheimReiteratesBuy—
20 June 2025RBC CapitalMaintainsOutperform—
13 June 2025GuggenheimMaintainsBuy—
15 May 2025RBC CapitalReiteratesOutperform—
31 Mar 2025GuggenheimMaintainsBuy—
31 Mar 2025HC Wainwright & Co.ReiteratesBuy—
7 Mar 2025Cantor FitzgeraldReiteratesOverweight—
24 Feb 2025Stephens & Co.MaintainsOverweight—
6 Jan 2025HC Wainwright & Co.ReiteratesBuy—
12 Dec 2024GuggenheimReiteratesBuy—
11 Dec 2024HC Wainwright & Co.ReiteratesBuy—

Price targets and ratings are third-party analyst estimates, reported here as data. They are not Ticker Nerd forecasts, and they are frequently wrong.

Market Radar

This page is one stock. Monday covers all of them.

ADCT appears in the Radar on the weeks it earns a place.

  • Market Radar, every Monday: the week's biggest rank moves across ~4,600 US stocks, and the reason for each.
  • The AI build-out map, free: every AI company we track on one page, with the model's Top picks in all four parts.

Free. Unsubscribe any time. Privacy

The AI build-out map
PDF
  • AI cloud capacity

    MSFTAMZNGOOGLORCL

  • AI chips

    NVDAAVGOAMDMU

  • AI networking and servers

    ANETDELLLITECRDO

  • Data centre power

    VRTCEGGEVVST

Performance

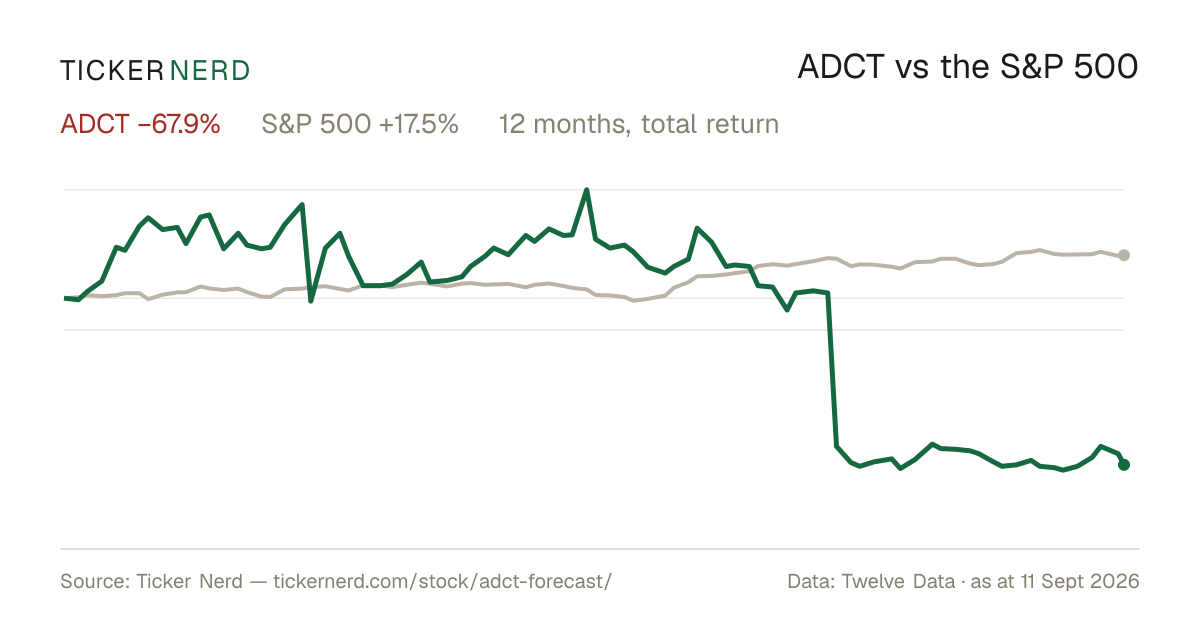
ADCT vs the S&P 500

Both lines are total return — dividends reinvested — so the comparison is honest on both sides.

Over the twelve months to 18 Nov 2026, ADC Therapeutics SA returned −65.8% against +12.2% for the S&P 500, dividends included.

ADCT vs S&P 500, last 12 monthsTotal return, rebased to 100
20406080100120Jan 26Apr 26Jul 26Oct 26ADCTS&P 500

Download this chart as an image — free to reuse; link this page as the source.

Data provided by Twelve Data

Estimates

ADCT analyst estimate revisions

Not the forecast itself — the direction analysts are revising it. Revision direction is one of the model's factor families.

Which way the estimates are movingThis fiscal year
Analysts raising
4
Analysts cutting
0
Fundamentals

ADC Therapeutics SA (ADCT) financial data

A margin means little on its own. Each bar marks where the figure sits across the whole US universe we score.

Valuation
Trailing P/E
−1.2×

Cheaper than 85% of US stocks

Price / sales
2.3×

Cheaper than 47% of US stocks

Price / book
−0.9×

Cheaper than 95% of US stocks

EV / EBITDA
−5.6×

Cheaper than 83% of US stocks

Growth & margins
Revenue growth (YoY)
32.2%

Higher than 79% of US stocks

Earnings growth (YoY)
2.2%

Higher than 40% of US stocks

Gross margin
87.8%

Higher than 95% of US stocks

Operating margin
−92.9%

Higher than 14% of US stocks

Net margin
−95.7%

Higher than 6% of US stocks

Returns & dividend
Return on equity
76.7%

Higher than 95% of US stocks

Return on assets
−18.1%

Higher than 21% of US stocks

Dividend yield
0.0%

Higher than 1% of US dividend payers

Bars mark the percentile across the ~4,600 US stocks Ticker Nerd covers, among those reporting the figure.

Key statistics

ADC Therapeutics SA (ADCT) statistics: revenue, profit & scale

The headline figures, each with its date. Every row carries its own link — cite it straight from here.

  • ADC Therapeutics SA has a market value of $189.9M and an enterprise value of $442.6M.

  • Revenue in the twelve months to 30 June 2026: $79.6M. The latest quarter grew 32.2% year on year.

  • Net income over the same four quarters: −$96.9M, a −121.8% net margin.

  • Diluted earnings per share, trailing twelve months: −$0.66.

  • Free cash flow in the twelve months to 30 June 2026: −$102.3M.

  • Shares outstanding: 127.4M.

  • Trailing P/E: −1.2×; forward P/E: −0.9× — the forward figure prices analyst consensus estimates, not reported earnings.

  • Forward dividend yield: 0.00%, paying out 0% of earnings.

  • ADC Therapeutics SA employs 188 people — $423K of revenue per employee.

Statement figures: company filings via Twelve Data, four quarters to 30 June 2026 · market figures as at 18 Nov 2026

Data provided by Twelve Data

Peers

ADCT vs competitors

The nearest names by industry and size, scored by the same model — like for like.

Its peer group, ranked by the same modelDrug Manufacturers - Specialty & Generic
CompanyMarket capTKN rank
ADCTADC Therapeutics SA$189.9M86
SIGASIGA Technologies, Inc.$195.6M51
ANIKAnika Therapeutics, Inc.$172.2M98
BIOABioAge Labs, Inc.$226.3M16
LFCRLifecore Biomedical, Inc.$242.2M2
EBSEmergent BioSolutions, Inc.$290.4M80
BGMBGM Group Ltd.$108.6M43

Look up any of the roughly 4,600 stocks we score.

The rank is the raw material. Whether the rules would actually own ADC Therapeutics SA — and when they’d sell — is the membership. See the Ticker Nerd 20 →

News

Latest ADCT news & analysis

ADC Therapeutics SA (ADCT) Reports Q3 Loss, Tops Revenue Estimates

Zacks Investment Research · 9 Nov 2026positive

ADC Therapeutics reported a quarterly loss of $0.16 per share, compared with the Zacks consensus estimate of a $0.21 loss and a $0.30 loss per share a year earlier. The headline also says the company topped revenue estimates.

Why it matters — ADCT watchers may note that the reported per-share loss was narrower than the consensus estimate and the prior-year loss.

ADC Therapeutics Reports Third Quarter 2026 Financial Results and Provides Operational Updates

PRNewsWire · 9 Nov 2026positive

ADC Therapeutics reported third-quarter 2026 net product revenue of $21 million and cash and cash equivalents of $189.2 million as of September 30. The company also cited a financial restructuring that extends expected cash runway into 2029, accepted ASH 2026 abstracts for ZYNLONTA, and Tanabe's Japanese marketing authorization filing and sublicensing.

Why it matters — The update covers ADCT’s financial position and runway alongside clinical and Japan-related regulatory and commercial developments.

ADC Therapeutics Reports Strong Lymphoma Responses, Plans Phase III Study

MarketBeat · 4 Nov 2026positive

ADC Therapeutics outlined new lymphoma data and plans for further studies of ZYNLONTA, including a Phase III study. It also reported preliminary third-quarter sales of approximately $21 million and said it expects its cash runway to extend into 2029.

Why it matters — ADCT watchers may be interested in the drug’s reported lymphoma data and the company’s plans for further clinical study, alongside its sales and cash-runway update.

ADC Therapeutics Announces Abstracts at the 68th ASH Annual Meeting Highlighting Breadth of ZYNLONTA® Clinical Program

PRNewsWire · 4 Nov 2026positive

ADC Therapeutics said ZYNLONTA data will be presented in five oral presentations and multiple posters at the 68th ASH Annual Meeting. The cited abstracts report an 88.7% ORR and 75.3% CR with ZYNLONTA plus glofitamab in 97 efficacy-evaluable patients with relapsed or refractory DLBCL, and a 93% ORR and 74.4% CRR with ZYNLONTA monotherapy in a marginal zone lymphoma study.

Why it matters — The presentations will provide ADCT watchers with clinical data spanning combination treatment in DLBCL and monotherapy in marginal zone lymphoma.

FAQ

Frequently asked questions about ADCT stock

What is the ADCT stock price forecast for 2026-2027?

The 5 Wall Street analysts covering ADC Therapeutics SA have a median 12-month price target of $3, with estimates ranging from $2 to $5. These are third-party analyst estimates, not Ticker Nerd forecasts, and they are frequently wrong.

Is ADCT stock a buy right now?

Of the 5 analysts covering ADC Therapeutics SA, 3 rate it a Buy, 2 a Hold and 0 a Sell. Ticker Nerd's systematic factor model ranks ADC Therapeutics SA 86 out of 100 across roughly 4,600 US stocks as at 17 Nov 2026. None of this is personal advice — it does not consider your circumstances.

How does Ticker Nerd's model rank ADCT?

As at 17 Nov 2026, ADC Therapeutics SA ranks 86 out of 100 on Ticker Nerd's systematic factor model — a percentile across roughly 4,600 US stocks, built from its factor families. Its strongest factor family is Growth (94 of 100).

Will ADCT stock go up?

No one can know that. What the data says: the median 12-month target from 5 analysts implies +119.0% from the last close, and Ticker Nerd's factor model ranks ADC Therapeutics SA 86 out of 100 as at 17 Nov 2026. Analyst targets are third-party estimates and frequently wrong; none of this is personal advice.

What is the ADCT stock forecast for 2030?

No analyst covering ADC Therapeutics SA publishes a 2030 price target — Wall Street targets run 12 to 18 months out. Sites quoting a 2030 price for ADCT are extrapolating price history, which says nothing about the business. The furthest attributed numbers are the current analyst targets: $2 to $5 over the next 12 months.

How has ADCT stock performed over the past year?

ADC Therapeutics SA returned -65.8% over the 12 months to 18 Nov 2026, with dividends reinvested. Past performance does not indicate future returns.

What does ADC Therapeutics SA do?

ADC Therapeutics SA is a Switzerland-based biotechnology company focused on developing and commercializing targeted antibody-drug conjugates for cancer treatment. Its portfolio centers on oncology programs designed to address hematological malignancies and solid tumors, with a particular emphasis on precision therapies that link monoclonal antibodies to potent cytotoxic agents.

What is the latest news on ADCT?

The most recent item we track (Zacks Investment Research, 9 Nov 2026): "ADC Therapeutics SA (ADCT) Reports Q3 Loss, Tops Revenue Estimates". ADC Therapeutics reported a quarterly loss of $0.16 per share, compared with the Zacks consensus estimate of a $0.21 loss and a $0.30 loss per share a year earlier. The headline also says the company topped revenue estimates.

Company

About ADC Therapeutics SA.

ADC Therapeutics SA is a Switzerland-based biotechnology company focused on developing and commercializing targeted antibody-drug conjugates for cancer treatment. Its portfolio centers on oncology programs designed to address hematological malignancies and solid tumors, with a particular emphasis on precision therapies that link monoclonal antibodies to potent cytotoxic agents. The company’s current products and pipeline include ZYNLONTA and several investigational candidates such as loncastuximab tesirine, camidanlumab tesirine, and ADCT-602. ADC Therapeutics SA operates in the specialty biopharmaceutical market, where antibody-drug conjugates are used to improve tumor targeting and expand treatment options for difficult-to-treat cancers. Headquartered in Epalinges, Switzerland, the company serves a global healthcare setting through research, development, and commercialization activities centered on next-generation oncology medicines.

CEO Dr. Ameet Mallik M.B.A., M.S. · 188 employees · Switzerland · https://www.adctherapeutics.com