AMCAMCCommunication Services · Entertainment

AMC Stock Forecast: AMC Entertainment Holdings, Inc. Price Predictions for 2026-2027

Last close, 3 Sept 2026
$2.54
−3.79% on the day

The 7 Wall Street analysts covering AMC Entertainment Holdings, Inc. hold a median 12-month price target of $2.5 — -1.6% from the last close. Ticker Nerd's systematic factor model, run across ~4,600 US stocks, ranks it 40 of 100 as at 2 Sept 2026 — in the lower half.

Market cap
$2.3B
Ticker Nerd rank
40 / 100
Median analyst target
$2.50
Analysts covering
7
Revenue$1.6B+14.2% y/y
Operating income$238.9M
Net income−$11.4M
Free cash flow$190.1M
Quarterly, 8 quarters to 30 June 2026 · latest quarter's figure shown
Total return, dividends reinvested
1W
−5.9%
1M
−10.9%
YTD
+62.8%
1Y
−6.3%
From 52W high
−19.4%
From 52W low
+167.4%
$0.95
$3.15
52-week range, adjusted closes · the dot is the last close
Ticker Nerd rank

AMC stock analysis: one number for the whole business

Consensus tells you what everyone already believes. The model scores AMC Entertainment Holdings, Inc. on its factor families — the same systematic rank behind the Ticker Nerd portfolio.

Where the model ranks itAs at 2 Sept 2026
40 / 100

Percentile across ~4,600 US stocks on Ticker Nerd’s systematic factor model. Higher is better. How the model is built and tested

Accruals
88
Revisions
55
Issuance
54
Growth
48
Momentum
46
Value
40
Quality
35
Size
34
Volatility
11

Accruals (88): Reported profit is backed by cash, and the company is not expanding recklessly.

Volatility (11): The share price moves around a lot.

Built and run by Aslam Ghouse, an ex-Goldman Sachs quant trader with fourteen years in markets.

Wall Street

AMC stock forecast 2026-2027: analyst price targets & predictions

The bullish and bearish analyst opinions on AMC, reported as data — targets and ratings, the market's view beside the model's.

Share price and the analyst range, 12 monthsAdjusted close, US dollars
$1.00$2.00$3.00$4.00Oct 25Jan 26Apr 26Jul 26AMCHigh $4.00Median $2.50Low $1.80

Price targets and ratings are third-party analyst estimates, reported here as data. They are not Ticker Nerd forecasts, and they are frequently wrong.

Data provided by Twelve Data

What Wall Street says7 analysts
2 Buy4 Hold1 Sell
Low $1.80Median $2.50High $4.00

The green dot is the last close — the median target sits −1.6% from it.

Recent analyst actionsNewest first

Of the 20 most recent actions, 5 moved their price target up and 0 moved it down.

DateFirmActionRatingTarget
22 July 2026B. Riley SecuritiesMaintainsNeutral$2.25$2.50
22 July 2026MacquarieMaintainsNeutral$2.00$2.50
21 July 2026BenchmarkMaintainsBuy$2.50$3.00
21 July 2026WedbushMaintainsOutperform$3.00$4.00
8 July 2026MacquarieMaintainsNeutral
8 July 2026MacquarieMaintainsNeutral$1.50$2.00
7 May 2026CitigroupMaintainsSell
6 May 2026BenchmarkUpgradeBuy
26 Feb 2026MacquarieMaintainsNeutral
25 Feb 2026CitigroupMaintainsSell
25 Feb 2026Roth CapitalMaintainsNeutral
15 Jan 2026MacquarieMaintainsNeutral
12 Jan 2026CitigroupMaintainsSell
13 Nov 2025CitigroupMaintainsSell
19 Aug 2025CitigroupMaintainsSell
11 July 2025WedbushUpgradeOutperform
29 May 2025CitigroupMaintainsSell
24 Apr 2025CitigroupMaintainsSell
16 Apr 2025Roth MKMMaintainsNeutral
7 Mar 2025CitigroupMaintainsSell

Price targets and ratings are third-party analyst estimates, reported here as data. They are not Ticker Nerd forecasts, and they are frequently wrong.

Market Radar

This page is one stock. Monday covers all of them.

Computed off the Friday close and sent before the US open.

Market Radar reports the week’s largest rank changes across roughly 4,600 US stocks, the factor behind each one, and where the market went. AMC appears on the weeks it earns a place.

Free, every Monday. Unsubscribe any time.

Performance

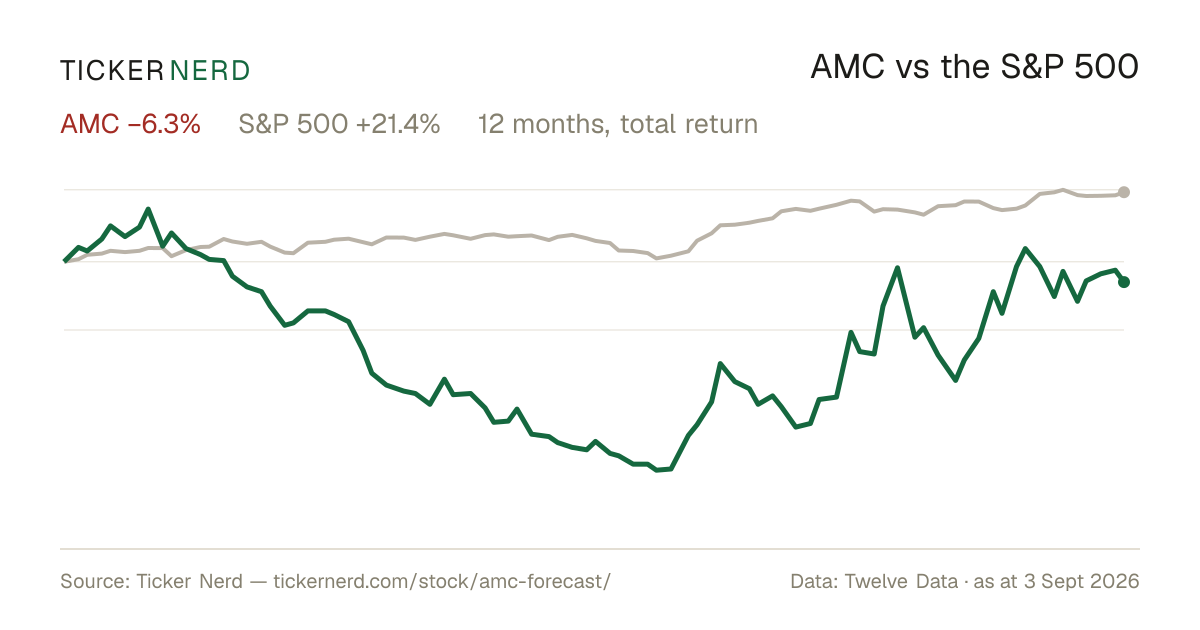
AMC vs the S&P 500

Both lines are total return — dividends reinvested — so the comparison is honest on both sides.

Over the twelve months to 3 Sept 2026, AMC Entertainment Holdings, Inc. returned −6.3% against +21.4% for the S&P 500, dividends included.

AMC vs S&P 500, last 12 monthsTotal return, rebased to 100
406080100120Oct 25Jan 26Apr 26Jul 26AMCS&P 500

Download this chart as an image — free to reuse; link this page as the source.

Data provided by Twelve Data

Estimates

AMC analyst estimate revisions

Not the forecast itself — the direction analysts are revising it. Revision direction is one of the model's factor families.

Which way the estimates are movingNext fiscal year
Analysts raising
1
Analysts cutting
0
Fundamentals

AMC Entertainment Holdings, Inc. (AMC) financial data

A margin means little on its own. Each bar marks where the figure sits across the whole US universe we score.

Valuation
Trailing P/E
−2.1×

Cheaper than 85% of US stocks

Price / sales
0.4×

Cheaper than 84% of US stocks

Price / book
−1.6×

Cheaper than 95% of US stocks

EV / EBITDA
15.8×

Cheaper than 21% of US stocks

Growth & margins
Revenue growth (YoY)
14.2%

Higher than 61% of US stocks

Earnings growth (YoY)
14.2%

Higher than 53% of US stocks

Gross margin
65.7%

Higher than 79% of US stocks

Operating margin
14.9%

Higher than 72% of US stocks

Net margin
−10.6%

Higher than 20% of US stocks

Returns & dividend
Return on equity
33.4%

Higher than 89% of US stocks

Return on assets
2.1%

Higher than 59% of US stocks

Dividend yield
46.6%

Higher than 97% of US dividend payers

Bars mark the percentile across the ~4,600 US stocks Ticker Nerd covers, among those reporting the figure.

Key statistics

AMC Entertainment Holdings, Inc. (AMC) statistics: revenue, profit & scale

The headline figures, each with its date. Every row carries its own link — cite it straight from here.

  • AMC Entertainment Holdings, Inc. has a market value of $2.3B and an enterprise value of $9.2B.

  • Revenue in the twelve months to 30 June 2026: $5.2B. The latest quarter grew 14.2% year on year.

  • Net income over the same four quarters: −$554.1M, a −10.6% net margin.

  • Diluted earnings per share, trailing twelve months: $−1.07.

  • Free cash flow in the twelve months to 30 June 2026: −$22.4M, after $241.1M of capital spending.

  • Shares outstanding: 892.6M.

  • Trailing P/E: −2.1×; forward P/E: −20.6× — the forward figure prices analyst consensus estimates, not reported earnings.

  • Forward dividend yield: 46.60%, paying out 0% of earnings.

  • AMC Entertainment Holdings, Inc. employs 2,931 people $1.8M of revenue per employee.

Statement figures: company filings via Twelve Data, four quarters to 30 June 2026 · market figures as at 2 Sept 2026

Data provided by Twelve Data

Peers

AMC vs competitors

The nearest names by industry and size, scored by the same model — like for like.

Its peer group, ranked by the same modelEntertainment
CompanyMarket capTKN rank
AMCAMC Entertainment Holdings, Inc.$2.3B
40
IMAXIMAX Corp.$2.8B
88
BATRKAtlanta Braves Holdings, Inc.$3.3B
22
MSGEMadison Square Garden Entertainment Corp.$3.7B
99
MANUManchester United Plc$3.7B
67
CNKCinemark Holdings, Inc.$4.1B
97
SPHRSphere Entertainment Co.$5.1B
47

Look up any of the roughly 4,600 stocks we score.

The rank is the raw material. Whether the rules would actually own AMC Entertainment Holdings, Inc. — and when they’d sell — is the membership. See the Ticker Nerd 20 →

News

Latest AMC news & analysis

AMC Enters Film Distribution With Leawood Films: Time to Buy the Stock?

Zacks Investment Research · 3 Sept 2026neutral

AMC Entertainment has launched a new film distribution venture called Leawood Films, which adds a new growth avenue for the company. The move comes alongside record EBITDA and strong premium-format demand, though leverage and cash-flow risks remain.

Why it matters — AMC watchers will care because the company is diversifying beyond theater exhibition into film distribution, which could reshape its growth profile even as balance-sheet risks persist.

Can AMC's Leaner Theatre Portfolio Sustain EBITDA Momentum?

Zacks Investment Research · 1 Sept 2026positive

Zacks Investment Research reports that AMC's leaner theatre portfolio, premium-format expansion, and stronger venue economics are likely boosting asset productivity and supporting EBITDA momentum. The analysis suggests these factors are contributing positively to the company's financial performance.

Why it matters — AMC watchers would care because asset productivity and premium-format growth are key indicators of whether the company can sustain its earnings momentum from its existing theatre base.

AMC Entertainment Creates “Leawood Films” With the Aim of Having More Movies Distributed on to the Big Screen

Business Wire · 31 Aug 2026positive

AMC Entertainment Holdings announced the creation of Leawood Films, a new film distribution company headquartered in both Los Angeles and Leawood, Kansas. The company will focus on bringing more movies to theatrical audiences in the U.S. and globally, leveraging AMC's marketing ability and exhibition network.

Why it matters — AMC watchers would care because this expansion into film distribution could broaden the company's supply of theatrical content and strengthen its position in the movie exhibition industry.

AMC's $10.4B Box-Office Threshold: Is Annual FCF Within Reach?

Zacks Investment Research · 26 Aug 2026positive

AMC has set a target of achieving positive annual free cash flow at a $10.4 billion domestic box-office threshold. The company's outlook is supported by record EBITDA, higher per-patron profits, and lower interest costs.

Why it matters — AMC watchers would care because the company has articulated a specific box-office benchmark tied to its ability to generate positive annual free cash flow.

AMC Entertainment: Watch The Share Count

Seeking Alpha · 26 Aug 2026positive

Seeking Alpha rates AMC Entertainment a speculative Buy with a $3.25 price target, citing catalyst-driven upside and noting that recent share dilution stemmed largely from one-off debt conversions and maturity redemptions, with those dilution mechanisms now removed. The article says unit economics have improved, with breakeven free cash flow at roughly $10.4B in domestic box office and leverage-driven interest savings providing further upside.

Why it matters — AMC watchers would care because the piece highlights that the primary mechanisms behind major share dilution have been eliminated, alongside improved unit economics and breakeven free-cash-flow levels, which bear directly on the company's capital structure and valuation outlook.

FAQ

Frequently asked questions about AMC stock

What is the AMC stock price forecast for 2026-2027?

The 7 Wall Street analysts covering AMC Entertainment Holdings, Inc. have a median 12-month price target of $2.5, with estimates ranging from $1.8 to $4. These are third-party analyst estimates, not Ticker Nerd forecasts, and they are frequently wrong.

Is AMC stock a buy right now?

Of the 7 analysts covering AMC Entertainment Holdings, Inc., 2 rate it a Buy, 4 a Hold and 1 a Sell. Ticker Nerd's systematic factor model ranks AMC Entertainment Holdings, Inc. 40 out of 100 across roughly 4,600 US stocks as at 2 Sept 2026. None of this is personal advice — it does not consider your circumstances.

How does Ticker Nerd's model rank AMC?

As at 2 Sept 2026, AMC Entertainment Holdings, Inc. ranks 40 out of 100 on Ticker Nerd's systematic factor model — a percentile across roughly 4,600 US stocks, built from its factor families. Its strongest factor family is Accruals (88 of 100).

Will AMC stock go up?

No one can know that. What the data says: the median 12-month target from 7 analysts implies -1.6% from the last close, and Ticker Nerd's factor model ranks AMC Entertainment Holdings, Inc. 40 out of 100 as at 2 Sept 2026. Analyst targets are third-party estimates and frequently wrong; none of this is personal advice.

What is the AMC stock forecast for 2030?

No analyst covering AMC Entertainment Holdings, Inc. publishes a 2030 price target — Wall Street targets run 12 to 18 months out. Sites quoting a 2030 price for AMC are extrapolating price history, which says nothing about the business. The furthest attributed numbers are the current analyst targets: $1.8 to $4 over the next 12 months.

How has AMC stock performed over the past year?

AMC Entertainment Holdings, Inc. returned -6.3% over the 12 months to 3 Sept 2026, with dividends reinvested. Past performance does not indicate future returns.

What does AMC Entertainment Holdings, Inc. do?

AMC Entertainment Holdings, Inc. Class A Common Stock represents AMC Entertainment Holdings, Inc., a movie exhibition company focused on theatrical entertainment.

What is the latest news on AMC?

The most recent item we track (Zacks Investment Research, 3 Sept 2026): "AMC Enters Film Distribution With Leawood Films: Time to Buy the Stock?". AMC Entertainment has launched a new film distribution venture called Leawood Films, which adds a new growth avenue for the company. The move comes alongside record EBITDA and strong premium-format demand, though leverage and cash-flow risks remain.

Company

About AMC Entertainment Holdings, Inc.

AMC Entertainment Holdings, Inc. Class A Common Stock represents AMC Entertainment Holdings, Inc., a movie exhibition company focused on theatrical entertainment. AMC owns, leases, and operates theatres in the United States and international markets, with a business centered on providing cinema experiences through traditional auditoriums and premium formats. Its theatres feature amenities such as recliner seating, dine-in options, full bars, and enhanced presentation technologies designed to support a broad range of moviegoing audiences. The company serves consumers through a network of locations across the U.S. and Europe, making it one of the most recognized operators in the theatrical exhibition market. AMC Entertainment Holdings, Inc. is headquartered in Leawood, Kansas, and its Class A Common Stock is the company’s primary voting equity class.

CEO Mr. Adam M. Aron · 2,931 employees · United States · https://www.amctheatres.com