BEBEIndustrials · Electrical Equipment & Parts

BE Stock Forecast: Bloom Energy Corp. Price Predictions for 2026-2027

Last close, 11 Sept 2026
$276
+6.68% on the day

The 29 Wall Street analysts covering Bloom Energy Corp. hold a median 12-month price target of $289 — +4.6% from the last close. Ticker Nerd's systematic factor model, run across ~4,600 US stocks, ranks it 70 of 100 as at 12 Sept 2026 — in the upper half. Here, the model and the Street point the same way.

Market cap
$81.2B
Ticker Nerd rank
70 / 100
Median analyst target
$289
Analysts covering
29
Revenue$1.1B+165.5% y/y
Operating income$182.2M
Net income$198.9M
Free cash flow$174.8M
Quarterly, 8 quarters to 30 June 2026 · latest quarter's figure shown
Total return, dividends reinvested
1W
+17.1%
1M
+30.6%
YTD
+217.4%
1Y
+309.8%
From 52W high
−20.3%
From 52W low
+311.4%
$67
$346
52-week range, adjusted closes · the dot is the last close
Ticker Nerd rank

BE stock analysis: one number for the whole business

Consensus tells you what everyone already believes. The model scores Bloom Energy Corp. on its factor families — the same systematic rank behind the Ticker Nerd portfolio.

Where the model ranks itAs at 12 Sept 2026
70 / 100

Percentile across ~4,600 US stocks on Ticker Nerd’s systematic factor model. Higher is better. How the model is built and tested

Revisions
98
Quality
94
Momentum
88
Growth
69
Accruals
61
Value
56
Volatility
17
Issuance
9
Size
4

Revisions (98): Analysts have, on balance, been raising their forecasts.

Issuance (9): The company has been issuing shares or taking on financing, diluting existing holders.

Size (4): Larger than most of the companies we track — more scrutinised, less often mispriced.

Built and run by Aslam Ghouse, an ex-Goldman Sachs quant trader with fourteen years in markets.

Wall Street

BE stock forecast 2026-2027: analyst price targets & predictions

The bullish and bearish analyst opinions on BE, reported as data — targets and ratings, the market's view beside the model's.

Share price and the analyst range, 12 monthsAdjusted close, US dollars
$0$100$200$300$400Oct 25Jan 26Apr 26Jul 26BEHigh $390Median $289Low $97

Price targets and ratings are third-party analyst estimates, reported here as data. They are not Ticker Nerd forecasts, and they are frequently wrong.

Data provided by Twelve Data

What Wall Street says29 analysts
15 Buy12 Hold2 Sell
Low $97Median $289High $390

The green dot is the last close — the median target sits +4.6% from it.

Recent analyst actionsNewest first

Of the 20 most recent actions, 2 moved their price target up and 6 moved it down.

DateFirmActionRatingTarget
27 Aug 2026BernsteinReiteratesMarket Perform$282
14 Aug 2026JefferiesMaintainsHold
14 Aug 2026JefferiesMaintainsHold$188$229
30 July 2026MizuhoUpgradeOutperform
30 July 2026MizuhoUpgradeOutperform$285$242
30 July 2026Truist SecuritiesMaintainsHold$250$218
30 July 2026Truist SecuritiesMaintainsHold
30 July 2026Wells FargoMaintainsEqual-Weight$217$176
30 July 2026Wells FargoMaintainsEqual-Weight
29 July 2026BernsteinMaintainsMarket Perform
29 July 2026BernsteinMaintainsMarket Perform$276$282
29 July 2026BMO CapitalMaintainsMarket Perform
29 July 2026BMO CapitalMaintainsMarket Perform$279$227
29 July 2026BTIGReiteratesBuy$295
29 July 2026BTIGReiteratesBuy
29 July 2026JP MorganMaintainsOverweight
29 July 2026JP MorganMaintainsOverweight$346$314
29 July 2026UBSMaintainsBuy$350$300
29 July 2026UBSMaintainsBuy
21 July 2026JP MorganMaintainsOverweight

Price targets and ratings are third-party analyst estimates, reported here as data. They are not Ticker Nerd forecasts, and they are frequently wrong.

Market Radar

This page is one stock. Monday covers all of them.

Computed off the Friday close and sent before the US open.

Market Radar reports the week’s largest rank changes across roughly 4,600 US stocks, the factor behind each one, and where the market went. BE appears on the weeks it earns a place.

Free, every Monday. Unsubscribe any time.

Performance

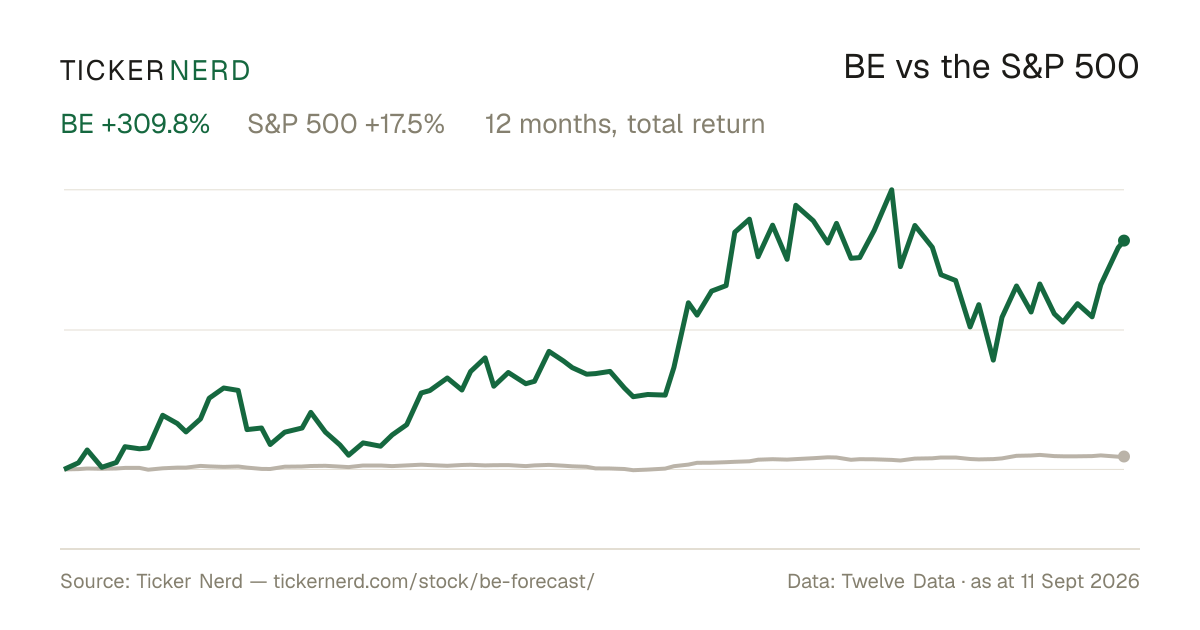
BE vs the S&P 500

Both lines are total return — dividends reinvested — so the comparison is honest on both sides.

Over the twelve months to 11 Sept 2026, Bloom Energy Corp. returned +309.8% against +17.5% for the S&P 500, dividends included.

BE vs S&P 500, last 12 monthsTotal return, rebased to 100
100200300400500Oct 25Jan 26Apr 26Jul 26BES&P 500

Download this chart as an image — free to reuse; link this page as the source.

Data provided by Twelve Data

Estimates

BE analyst estimate revisions

Not the forecast itself — the direction analysts are revising it. Revision direction is one of the model's factor families.

Which way the estimates are movingNext fiscal year
EPS revision, 90 days
+27.3%
Analysts raising
24
Analysts cutting
0
Fundamentals

Bloom Energy Corp. (BE) financial data

A margin means little on its own. Each bar marks where the figure sits across the whole US universe we score.

Valuation
Trailing P/E
358.1×

Cheaper than 2% of US stocks

Price / sales
26.1×

Cheaper than 8% of US stocks

Price / book
50.2×

Cheaper than 2% of US stocks

EV / EBITDA
194.4×

Cheaper than 1% of US stocks

Growth & margins
Revenue growth (YoY)
165.5%

Higher than 95% of US stocks

Earnings growth (YoY)
165.5%

Higher than 89% of US stocks

Gross margin
33.4%

Higher than 39% of US stocks

Operating margin
17.1%

Higher than 75% of US stocks

Net margin
7.9%

Higher than 66% of US stocks

Returns & dividend
Return on equity
22.2%

Higher than 83% of US stocks

Return on assets
5.6%

Higher than 79% of US stocks

Dividend yield

Bars mark the percentile across the ~4,600 US stocks Ticker Nerd covers, among those reporting the figure.

Key statistics

Bloom Energy Corp. (BE) statistics: revenue, profit & scale

The headline figures, each with its date. Every row carries its own link — cite it straight from here.

  • Bloom Energy Corp. has a market value of $81.2B and an enterprise value of $81.3B.

  • Revenue in the twelve months to 30 June 2026: $3.1B. The latest quarter grew 165.5% year on year.

  • Net income over the same four quarters: $251.0M, a 8.1% net margin.

  • Diluted earnings per share, trailing twelve months: $0.75.

  • Free cash flow in the twelve months to 30 June 2026: $624.7M.

  • Shares outstanding: 293.4M.

  • Trailing P/E: 358.1×; forward P/E: 56.0× — the forward figure prices analyst consensus estimates, not reported earnings.

  • Bloom Energy Corp. employs 2,214 people $1.4M of revenue per employee.

Statement figures: company filings via Twelve Data, four quarters to 30 June 2026 · market figures as at 13 Sept 2026

Data provided by Twelve Data

Peers

BE vs competitors

The nearest names by industry and size, scored by the same model — like for like.

Its peer group, ranked by the same modelElectrical Equipment & Parts
CompanyMarket capTKN rank
BEBloom Energy Corp.$81.2B
70
VRTVertiv Holdings Co.$98.3B
83
NVTnVent Electric plc$26.3B
97
HUBBHubbell, Inc.$24.5B
75
AEISAdvanced Energy Industries, Inc.$11.5B
67
FPSForgent Power Solutions, Inc.$10.2B
2
AYIAcuity, Inc.$9.5B
98

Look up any of the roughly 4,600 stocks we score.

The rank is the raw material. Whether the rules would actually own Bloom Energy Corp. — and when they’d sell — is the membership. See the Ticker Nerd 20 →

News

Latest BE news & analysis

Cramer Asked Who Was Buying Gigantic Bloom Energy Calls. A Pelosi Filing Named Two of the Same Stocks Weeks Earlier.

24/7 Wall Street · 12 Sept 2026neutral

Jim Cramer used his Mad Dash segment on CNBC's Squawk on the Street to flag what he described as outsized call buying, executed through flex calls, across a basket of technology and energy names. A Pelosi filing had named two of the same stocks weeks earlier.

Why it matters — Bloom Energy appears among the stocks singled out, so a BE watcher would care about the unusual options activity being publicly highlighted.

Stock Of The Day: AI Energy Play Bloom Energy Nears Buy Point, S&P 500 Entry

Investors Business Daily · 11 Sept 2026positive

Bloom Energy, described as an AI energy play and a leader in the No. 2-ranked alternative energy group, will join the S&P 500 index. The move brings the company near a potential buy point.

Why it matters — Being added to the S&P 500 is a significant milestone for Bloom Energy that could increase its visibility and attract broader investor interest.

Bloom Energy Hits the Road with ESPN College Football Campus Tour to Bring the Power Conversation to Communities Nationwide

Business Wire · 11 Sept 2026positive

Bloom Energy announced it will join the ESPN College Football Campus Tour for a season-long partnership, bringing conversations about the future of power to college communities nationwide. The tour begins September 12 in College Station, Texas, and will combine football excitement with local community engagement and support of emergency response efforts.

Why it matters — The campaign raises Bloom Energy's brand visibility and public awareness of its power solutions across college communities nationwide.

Bloom Energy Climbs 7% as Fuel Cell Bid Spreads Beyond Its S&P 500 Add, FuelCell Energy Rises 4%, Plug Power Inches Higher

24/7 Wall Street · 11 Sept 2026positive

Bloom Energy shares rose 7% to $276.31 in Friday morning trading after S&P Dow Jones Indices confirmed the fuel cell maker's addition to the S&P 500. Peer fuel cell stocks also moved higher, with FuelCell Energy up 4% and Plug Power edging higher.

Why it matters — Bloom Energy's confirmed inclusion in the S&P 500 is a significant index-related development for the company and its shareholders.

Renewable Energy & Battery Stocks to Buy Amid Global Warming Woes

Zacks Investment Research · 11 Sept 2026positive

Zacks Investment Research published a piece highlighting rising power demand from AI, electric vehicles, and extreme heat as a driver for renewables and energy storage, spotlighting three stocks positioned for the energy transition.

Why it matters — As a clean-energy company, Bloom Energy is part of the sector the article frames as benefiting from growing power demand and the broader energy transition.

FAQ

Frequently asked questions about BE stock

What is the BE stock price forecast for 2026-2027?

The 29 Wall Street analysts covering Bloom Energy Corp. have a median 12-month price target of $289, with estimates ranging from $97 to $390. These are third-party analyst estimates, not Ticker Nerd forecasts, and they are frequently wrong.

Is BE stock a buy right now?

Of the 29 analysts covering Bloom Energy Corp., 15 rate it a Buy, 12 a Hold and 2 a Sell. Ticker Nerd's systematic factor model ranks Bloom Energy Corp. 70 out of 100 across roughly 4,600 US stocks as at 12 Sept 2026. None of this is personal advice — it does not consider your circumstances.

How does Ticker Nerd's model rank BE?

As at 12 Sept 2026, Bloom Energy Corp. ranks 70 out of 100 on Ticker Nerd's systematic factor model — a percentile across roughly 4,600 US stocks, built from its factor families. Its strongest factor family is Revisions (98 of 100).

Will BE stock go up?

No one can know that. What the data says: the median 12-month target from 29 analysts implies +4.6% from the last close, and Ticker Nerd's factor model ranks Bloom Energy Corp. 70 out of 100 as at 12 Sept 2026. Analyst targets are third-party estimates and frequently wrong; none of this is personal advice.

What is the BE stock forecast for 2030?

No analyst covering Bloom Energy Corp. publishes a 2030 price target — Wall Street targets run 12 to 18 months out. Sites quoting a 2030 price for BE are extrapolating price history, which says nothing about the business. The furthest attributed numbers are the current analyst targets: $97 to $390 over the next 12 months.

How has BE stock performed over the past year?

Bloom Energy Corp. returned +309.8% over the 12 months to 11 Sept 2026, with dividends reinvested. Past performance does not indicate future returns.

What does Bloom Energy Corp. do?

Bloom Energy Corp. Class A Common Stock represents Bloom Energy, a clean energy technology company focused on on-site power generation and hydrogen production.

What is the latest news on BE?

The most recent item we track (24/7 Wall Street, 12 Sept 2026): "Cramer Asked Who Was Buying Gigantic Bloom Energy Calls. A Pelosi Filing Named Two of the Same Stocks Weeks Earlier.". Jim Cramer used his Mad Dash segment on CNBC's Squawk on the Street to flag what he described as outsized call buying, executed through flex calls, across a basket of technology and energy names. A Pelosi filing had named two of the same stocks weeks earlier.

Company

About Bloom Energy Corp.

Bloom Energy Corp. Class A Common Stock represents Bloom Energy, a clean energy technology company focused on on-site power generation and hydrogen production. The company designs, manufactures, sells, and installs solid oxide fuel cell systems that generate electricity through an electrochemical process rather than combustion. Its core product, the Bloom Energy Server, is used by commercial, industrial, and utility customers to provide reliable distributed power for applications such as data centers, healthcare, manufacturing, telecommunications, and other critical infrastructure. Bloom Energy also offers the Bloom Electrolyzer, which supports hydrogen production using the same solid oxide platform. Headquartered in San Jose, California, Bloom Energy plays a significant role in the distributed energy market by delivering fuel-flexible systems that can operate on natural gas, biogas, hydrogen, or blended fuels.

CEO Dr. K. R. Sridhar Ph.D. · 2,214 employees · United States · https://www.bloomenergy.com