BOCBOCIndustrials · Conglomerates

BOC Stock Forecast: Boston Omaha Corp. Price Predictions for 2026-2027

Last close, 21 Aug 2026
$14
+2.32% on the day

Ticker Nerd's systematic factor model, run across ~4,600 US stocks, ranks it 61 of 100 as at 22 Aug 2026 — in the upper half.

Market cap
$425.7M
Ticker Nerd rank
61 / 100
Median analyst target
Analysts covering
1
Total return, dividends reinvested
1W
+1.4%
1M
+0.1%
YTD
+14.2%
1Y
+12.5%
From 52W high
−6.4%
From 52W low
+27.8%
$11
$15
52-week range, adjusted closes · the dot is the last close
Ticker Nerd rank

BOC stock analysis: one number for the whole business

Consensus tells you what everyone already believes. The model scores Boston Omaha Corp. on its factor families — the same systematic rank behind the Ticker Nerd portfolio.

Where the model ranks itAs at 22 Aug 2026
61 / 100

Percentile across ~4,600 US stocks on Ticker Nerd’s systematic factor model. Higher is better. How the model is built and tested

Volatility
99
Issuance
91
Accruals
70
Momentum
65
Quality
58
Size
56
Value
55
Revisions
25
Growth
20

Volatility (99): The share price has been relatively steady.

Growth (20): Sales and profits are flat, shrinking, or growing more slowly than they were.

Built and run by Aslam Ghouse, an ex-Goldman Sachs quant trader with fourteen years in markets.

Wall Street

BOC stock forecast 2026-2027: analyst price targets & predictions

The bullish and bearish analyst opinions on BOC, reported as data — targets and ratings, the market's view beside the model's.

Share price and the analyst range, 12 monthsAdjusted close, US dollars
$11$12$13$14$15Oct 25Jan 26Apr 26Jul 26BOC

Price targets and ratings are third-party analyst estimates, reported here as data. They are not Ticker Nerd forecasts, and they are frequently wrong.

What Wall Street says1 analysts
0 Buy1 Hold0 Sell
Recent analyst actionsNewest first
DateFirmActionRatingTarget
9 Apr 2025TD CowenMaintainsBuy$28$25
19 Sept 2024Wells FargoDowngradeEqual-Weight
21 Aug 2024TD CowenMaintainsBuy
20 May 2024Wells FargoMaintainsOverweight
2 Apr 2024TD CowenMaintainsBuy
29 Aug 2023TD CowenMaintainsOutperform
25 Aug 2023Wells FargoMaintainsOverweight
24 May 2023Wells FargoMaintainsOverweight
18 May 2023TD CowenMaintainsOutperform
31 Mar 2023TD CowenMaintainsOutperform
29 Mar 2023Wells FargoMaintainsOverweight
1 Nov 2022Wells FargoMaintainsOverweight
25 May 2022Wells FargoMaintainsOverweight
12 Apr 2022Wells FargoMaintainsOverweight
5 June 2020Wells FargoInitiatesOverweight

Price targets and ratings are third-party analyst estimates, reported here as data. They are not Ticker Nerd forecasts, and they are frequently wrong.

Market Radar

This page is one stock. Monday covers all of them.

Computed off the Friday close and sent before the US open.

Market Radar reports the week’s largest rank changes across roughly 4,600 US stocks, the factor behind each one, and where the market went. BOC appears on the weeks it earns a place.

Free, every Monday. Unsubscribe any time.

Estimates

BOC analyst estimate revisions

Not the forecast itself — the direction analysts are revising it. Revision direction is one of the model's factor families.

Which way the estimates are movingNext fiscal year
Analysts raising
0
Analysts cutting
0
Fundamentals

Boston Omaha Corp. (BOC) financial data

A margin means little on its own. Each bar marks where the figure sits across the whole US universe we score.

Valuation
Trailing P/E
616.0×

Cheaper than 1% of US stocks

Price / sales
3.7×

Cheaper than 35% of US stocks

Price / book
0.9×

Cheaper than 78% of US stocks

EV / EBITDA
22.6×

Cheaper than 13% of US stocks

Growth & margins
Revenue growth (YoY)
2.4%

Higher than 33% of US stocks

Earnings growth (YoY)
1.9%

Higher than 38% of US stocks

Gross margin
61.8%

Higher than 75% of US stocks

Operating margin
−3.3%

Higher than 29% of US stocks

Net margin
−11.4%

Higher than 19% of US stocks

Returns & dividend
Return on equity
−2.9%

Higher than 41% of US stocks

Return on assets
−0.3%

Higher than 42% of US stocks

Dividend yield

Bars mark the percentile across the ~4,600 US stocks Ticker Nerd covers, among those reporting the figure.

Peers

BOC vs competitors

The nearest names by industry and size, scored by the same model — like for like.

Its peer group, ranked by the same modelConglomerates
CompanyMarket capTKN rank
BOCBoston Omaha Corp.$425.7M
61
TRCTejon Ranch Co.$442.1M
66
FIPFTAI Infrastructure, Inc.$444.2M
28
AIAIAIAI Holdings Corp.$515.8M
1
NNBRNN, Inc.$312.2M
77
RCMTRCM Technologies, Inc.$287.0M
100
MATWMatthews International Corp.$662.1M
41

Look up any of the roughly 4,600 stocks we score.

The rank is the raw material. Whether the rules would actually own Boston Omaha Corp. — and when they’d sell — is the membership. See the Ticker Nerd 20 →

News

Latest BOC news & analysis

Boston Omaha Corporation Announces Second Quarter 2026 Financial Results

Business Wire · 13 Aug 2026neutral

Boston Omaha Corporation announced its financial results for the second quarter ended June 30, 2026, in connection with filing its Quarterly Report on Form 10-Q with the SEC. The company provided summary financial data for the second quarters of 2026 and 2025, along with a supplemental presentation of additional financial information.

Why it matters — A BOC watcher would care because this quarterly filing and financial results update provides the latest performance figures for the company.

FAQ

Frequently asked questions about BOC stock

Is BOC stock a buy right now?

Of the 1 analysts covering Boston Omaha Corp., 0 rate it a Buy, 1 a Hold and 0 a Sell. Ticker Nerd's systematic factor model ranks Boston Omaha Corp. 61 out of 100 across roughly 4,600 US stocks as at 22 Aug 2026. None of this is personal advice — it does not consider your circumstances.

How does Ticker Nerd's model rank BOC?

As at 22 Aug 2026, Boston Omaha Corp. ranks 61 out of 100 on Ticker Nerd's systematic factor model — a percentile across roughly 4,600 US stocks, built from its factor families. Its strongest factor family is Volatility (99 of 100).

What is the BOC stock forecast for 2030?

No analyst covering Boston Omaha Corp. publishes a 2030 price target — Wall Street targets run 12 to 18 months out. Sites quoting a 2030 price for BOC are extrapolating price history, which says nothing about the business.

How has BOC stock performed over the past year?

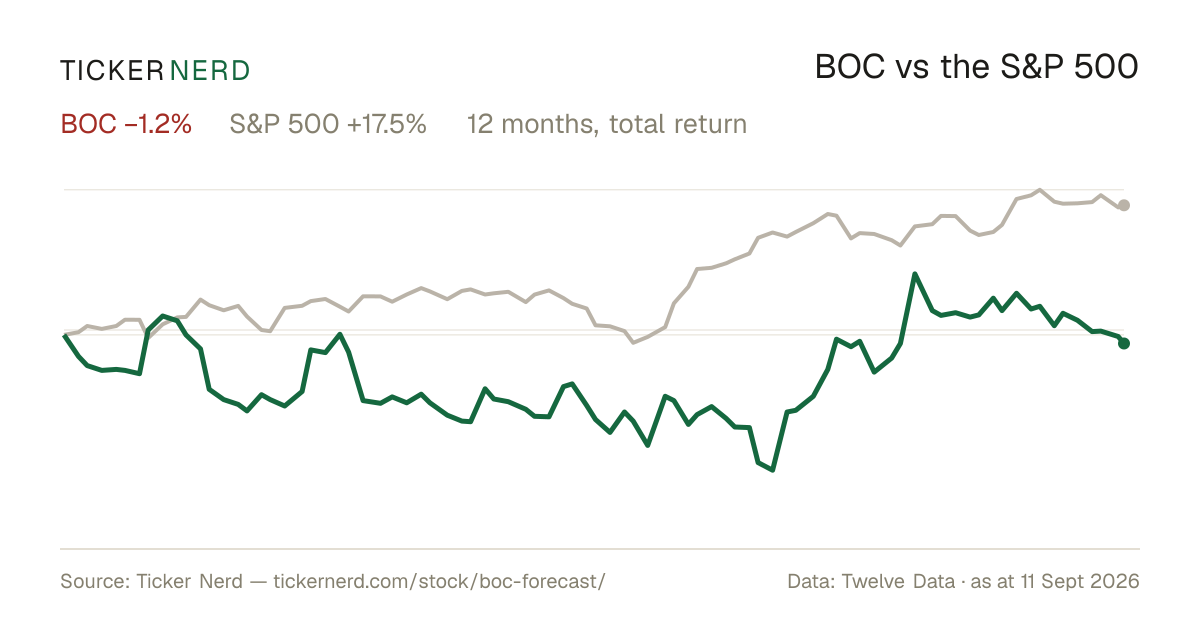
Boston Omaha Corp. returned +12.5% over the 12 months to 21 Aug 2026, with dividends reinvested. Past performance does not indicate future returns.

What does Boston Omaha Corp. do?

Boston Omaha Corporation engages in a diverse range of business activities, primarily focusing on the acquisition and management of businesses across multiple sectors. As a holding company, its operations span various industries, including billboard advertising, insurance, and broadband services.

What is the latest news on BOC?

The most recent item we track (Business Wire, 13 Aug 2026): "Boston Omaha Corporation Announces Second Quarter 2026 Financial Results". Boston Omaha Corporation announced its financial results for the second quarter ended June 30, 2026, in connection with filing its Quarterly Report on Form 10-Q with the SEC. The company provided summary financial data for the second quarters of 2026 and 2025, along with a supplemental presentation of additional financial information.

Company

About Boston Omaha Corp.

Boston Omaha Corporation engages in a diverse range of business activities, primarily focusing on the acquisition and management of businesses across multiple sectors. As a holding company, its operations span various industries, including billboard advertising, insurance, and broadband services. The company owns and operates a significant portfolio of outdoor billboards, providing advertising spaces in strategic locations across the United States, thus contributing to the out-of-home advertising sector. Boston Omaha also invests in insurance services through its subsidiary companies, offering a spectrum of insurance coverage to individuals and businesses. Additionally, it ventures into broadband services, reflecting its interest in expanding into emerging technological infrastructure. Founded in 2009 and based in Omaha, Nebraska, Boston Omaha Corporation plays a crucial role in facilitating capital allocation and operational management across its subsidiary businesses. Its strategic investments and diverse business portfolio aim to deliver value by capitalizing on opportunities in varying market environments, positioning it as an influential player in the sectors it operates.

CEO Mr. Adam Kenneth Peterson · 380 employees · United States · https://www.bostonomaha.com