BSINBSINEnergy · Oil & Gas E&P

BSIN Stock Forecast: Big Sky Industrial, Inc. Price Predictions for 2026-2027

Last close, 3 Aug 2026
$1.13
−0.88% on the day

The 1 Wall Street analysts covering Big Sky Industrial, Inc. hold a median 12-month price target of $2.75 — +143.4% from the last close. Ticker Nerd's systematic factor model, run across ~4,600 US stocks, ranks it 12 of 100 as at 1 Aug 2026 — in the weakest quartile. The Street sees upside; the factor read is a caution. That gap is the story on this page.

Market cap
$59.6M
Ticker Nerd rank
12 / 100
Median analyst target
$2.75
Analysts covering
1
Total return, dividends reinvested
1W
−5.8%
1M
+2.7%
YTD
+22.8%
1Y
−4.2%
From 52W high
−21.0%
From 52W low
+63.8%
$0.69
$1.43
52-week range, adjusted closes · the dot is the last close
Ticker Nerd rank

BSIN stock analysis: one number for the whole business

Consensus tells you what everyone already believes. The model scores Big Sky Industrial, Inc. on its factor families — the same systematic rank behind the Ticker Nerd portfolio.

Where the model ranks itAs at 1 Aug 2026
12 / 100

Percentile across ~4,600 US stocks on Ticker Nerd’s systematic factor model. Higher is better. How the model is built and tested

Size
80
Accruals
64
Momentum
42
Revisions
35
Growth
26
Volatility
21
Issuance
12
Quality
8
Value
4

Size (80): Smaller than most of the companies we track.

Value (4): The shares cost a lot relative to the profits and assets behind them.

The rank is the raw material. Whether the rules would actually own Big Sky Industrial, Inc. — and when they’d sell — is the membership.

Wall Street

BSIN stock forecast 2026-2027: analyst price targets & predictions

The bullish and bearish analyst opinions on BSIN, reported as data — targets and ratings, the market's view beside the model's.

Share price and the analyst range, 12 monthsAdjusted close, US dollars
$0.00$1.00$2.00$3.00$4.00Oct 25Jan 26Apr 26Jul 26BSINHigh $3.50Median $2.75Low $2.00

Price targets and ratings are third-party analyst estimates, reported here as data. They are not Ticker Nerd forecasts, and they are frequently wrong.

What Wall Street says1 analysts
1 Buy0 Hold0 Sell
Low $2.00Median $2.75High $3.50

The green dot is the last close — the median target sits +143.4% from it.

Recent analyst actionsNewest first
DateFirmActionRatingTarget
10 Mar 2026D. Boral CapitalMaintainsBuy
13 Aug 2025D. Boral CapitalMaintainsBuy
13 May 2025D. Boral CapitalMaintainsBuy
13 Mar 2025D. Boral CapitalMaintainsBuy
24 Jan 2025D. Boral CapitalMaintainsBuy
13 Jan 2025D. Boral CapitalMaintainsBuy
3 Jan 2025D. Boral CapitalMaintainsBuy
13 Nov 2024D. Boral CapitalMaintainsBuy$2.00
1 Nov 2024EF HuttonMaintainsBuy
9 Aug 2024EF HuttonMaintainsBuy
12 June 2024EF HuttonMaintainsBuy
13 May 2024EF HuttonMaintainsBuy
28 Mar 2024EF HuttonMaintainsBuy
15 Aug 2023EF HuttonMaintainsBuy
5 July 2023EF HuttonAssumesBuy$3.00
25 May 2023EF HuttonAssumesBuy$3.00
15 May 2023EF HuttonReiteratesBuy
14 Apr 2023EF HuttonMaintainsBuy
28 Feb 2023EF HuttonMaintainsBuy
21 Dec 2022EF HuttonAssumesBuy$4.00

Price targets and ratings are third-party analyst estimates, reported here as data. They are not Ticker Nerd forecasts, and they are frequently wrong.

Estimates

BSIN analyst estimate revisions

Not the forecast itself — the direction analysts are revising it. Revision direction is one of the model's factor families.

Which way the estimates are movingNext fiscal year
Analysts raising
1
Analysts cutting
0
Fundamentals

Big Sky Industrial, Inc. (BSIN) financial data

A margin means little on its own. Each bar marks where the figure sits across the whole US universe we score.

Valuation
Trailing P/E
28.4×

Cheaper than 29% of US stocks

Price / sales
9.6×

Cheaper than 15% of US stocks

Price / book
1.6×

Cheaper than 54% of US stocks

EV / EBITDA
−7.1×

Cheaper than 81% of US stocks

Growth & margins
Revenue growth (YoY)
−27.9%

Higher than 9% of US stocks

Earnings growth (YoY)
−26.9%

Higher than 16% of US stocks

Gross margin
0.3%

Higher than 5% of US stocks

Operating margin
−213.3%

Higher than 11% of US stocks

Net margin
−231.4%

Higher than 2% of US stocks

Returns & dividend
Return on equity
−40.1%

Higher than 24% of US stocks

Return on assets
−15.8%

Higher than 22% of US stocks

Dividend yield
7.9%

Higher than 89% of US dividend payers

Bars mark the percentile across the ~4,600 US stocks Ticker Nerd covers, among those reporting the figure.

Peers

BSIN vs competitors

The nearest names by industry and size, scored by the same model — like for like.

Its peer group, ranked by the same modelOil & Gas E&P
CompanyMarket capTKN rank
BSINBig Sky Industrial, Inc.$59.6M
12
PROPPrairie Operating Co.$69.5M
70
INDOIndonesia Energy Corp. Ltd.$44.3M
15
GLNDGreenland Energy Co.$96.3M
2
EPEmpire Petroleum Corp.$99.1M
8
BATLBattalion Oil Corp.$31.1M
32
EPMEvolution Petroleum Corp.$127.7M
35
Market Radar

This page is one stock. Monday covers all of them.

Computed off the Friday close and sent before the US open.

Market Radar reports the week’s largest rank changes across roughly 4,600 US stocks, the factor behind each one, and where the market went. BSIN appears on the weeks it earns a place.

Free, every Monday. Unsubscribe any time.

FAQ

Frequently asked questions about BSIN stock

What is the BSIN stock price forecast for 2026-2027?

The 1 Wall Street analysts covering Big Sky Industrial, Inc. have a median 12-month price target of $2.75, with estimates ranging from $2 to $3.5. These are third-party analyst estimates, not Ticker Nerd forecasts, and they are frequently wrong.

Is BSIN stock a buy right now?

Of the 1 analysts covering Big Sky Industrial, Inc., 1 rate it a Buy, 0 a Hold and 0 a Sell. Ticker Nerd's systematic factor model ranks Big Sky Industrial, Inc. 12 out of 100 across roughly 4,600 US stocks as at 1 Aug 2026. None of this is personal advice — it does not consider your circumstances.

How does Ticker Nerd's model rank BSIN?

As at 1 Aug 2026, Big Sky Industrial, Inc. ranks 12 out of 100 on Ticker Nerd's systematic factor model — a percentile across roughly 4,600 US stocks, built from its factor families. Its strongest factor family is Size (80 of 100).

Will BSIN stock go up?

No one can know that. What the data says: the median 12-month target from 1 analysts implies +143.4% from the last close, and Ticker Nerd's factor model ranks Big Sky Industrial, Inc. 12 out of 100 as at 1 Aug 2026. Analyst targets are third-party estimates and frequently wrong; none of this is personal advice.

What is the BSIN stock forecast for 2030?

No analyst covering Big Sky Industrial, Inc. publishes a 2030 price target — Wall Street targets run 12 to 18 months out. Sites quoting a 2030 price for BSIN are extrapolating price history, which says nothing about the business. The furthest attributed numbers are the current analyst targets: $2 to $3.5 over the next 12 months.

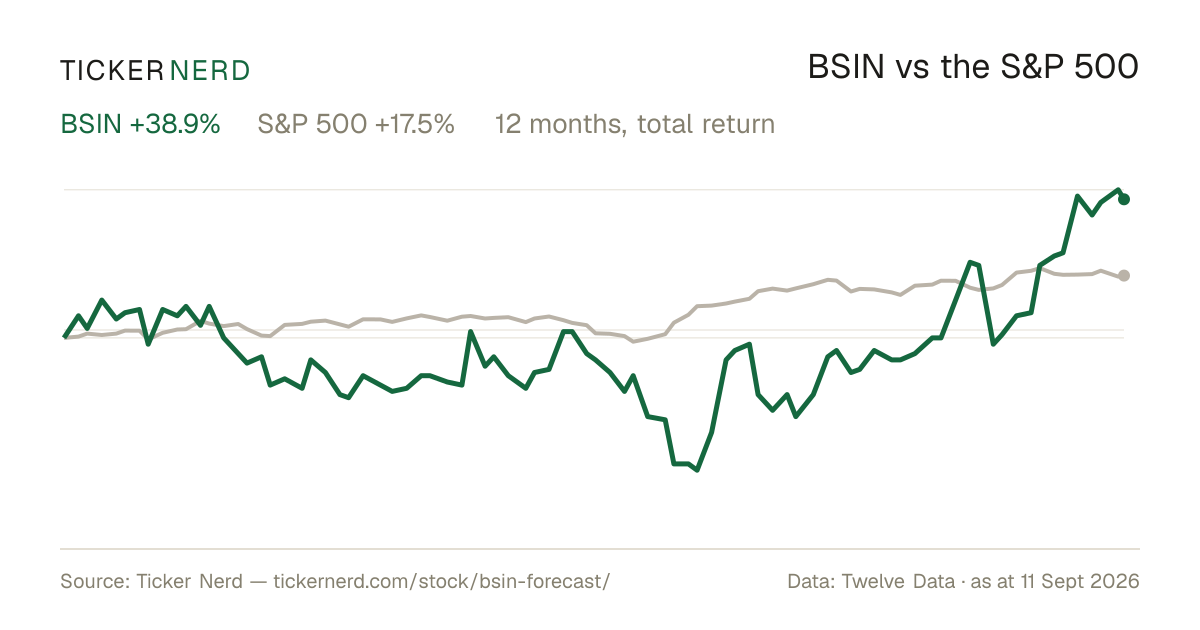
How has BSIN stock performed over the past year?

Big Sky Industrial, Inc. returned -4.2% over the 12 months to 3 Aug 2026, with dividends reinvested. Past performance does not indicate future returns.

What does Big Sky Industrial, Inc. do?

U.S. Energy Corp.

Company

About Big Sky Industrial, Inc.

U.S. Energy Corp. is an independent energy company focused on the acquisition, development, and operation of producing oil and natural gas properties in the continental United States. The company’s portfolio is concentrated in onshore regions across the Rockies, the Mid-Continent, West Texas, South Texas, and the Gulf Coast, where it participates in exploration and production activities tied to domestic hydrocarbon output. U.S. Energy Corp. generates revenue from its interests in oil and natural gas sales and operates within the upstream segment of the energy market. Today, the company is also associated with a broader portfolio of producing assets and capital return-oriented operations, positioning it as a small-cap participant in the U.S. energy sector.

CEO Mr. Ryan Lewis Smith · 20 employees · United States · https://www.usnrg.com