EPEPEnergy · Oil & Gas E&P

EP Stock Forecast: Empire Petroleum Corp. Price Predictions for 2026-2027

Last close, 11 Aug 2026
$2.65
−3.99% on the day

Ticker Nerd's systematic factor model, run across ~4,600 US stocks, ranks it 7 of 100 as at 10 Aug 2026 — in the weakest quartile.

Market cap
$109.8M
Ticker Nerd rank
7 / 100
Median analyst target
Analysts covering
0
Total return, dividends reinvested
1W
+7.3%
1M
+0.4%
YTD
−12.8%
1Y
−42.5%
From 52W high
−52.7%
From 52W low
+9.1%
$2.43
$5.60
52-week range, adjusted closes · the dot is the last close
Ticker Nerd rank

EP stock analysis: one number for the whole business

Consensus tells you what everyone already believes. The model scores Empire Petroleum Corp. on its factor families — the same systematic rank behind the Ticker Nerd portfolio.

Where the model ranks itAs at 10 Aug 2026
7 / 100

Percentile across ~4,600 US stocks on Ticker Nerd’s systematic factor model. Higher is better. How the model is built and tested

Accruals
95
Size
74
Revisions
25
Issuance
16
Value
11
Volatility
9
Quality
9
Growth
7
Momentum
4

Accruals (95): Reported profit is backed by cash, and the company is not expanding recklessly.

Momentum (4): The shares have been drifting down relative to others.

Wall Street

EP stock forecast 2026-2027: analyst price targets & predictions

The bullish and bearish analyst opinions on EP, reported as data — targets and ratings, the market's view beside the model's.

Share price and the analyst range, 12 monthsAdjusted close, US dollars
$2.00$2.50$3.00$3.50$4.00$4.50$5.00$5.50Oct 25Jan 26Apr 26Jul 26EP

Price targets and ratings are third-party analyst estimates, reported here as data. They are not Ticker Nerd forecasts, and they are frequently wrong.

Price targets and ratings are third-party analyst estimates, reported here as data. They are not Ticker Nerd forecasts, and they are frequently wrong.

Market Radar

This page is one stock. Monday covers all of them.

Computed off the Friday close and sent before the US open.

Market Radar reports the week’s largest rank changes across roughly 4,600 US stocks, the factor behind each one, and where the market went. EP appears on the weeks it earns a place.

Free, every Monday. Unsubscribe any time.

Estimates

EP analyst estimate revisions

Not the forecast itself — the direction analysts are revising it. Revision direction is one of the model's factor families.

Fundamentals

Empire Petroleum Corp. (EP) financial data

A margin means little on its own. Each bar marks where the figure sits across the whole US universe we score.

Valuation
Trailing P/E
221.5×

Cheaper than 3% of US stocks

Price / sales
3.3×

Cheaper than 39% of US stocks

Price / book
29.4×

Cheaper than 4% of US stocks

EV / EBITDA
−12.0×

Cheaper than 85% of US stocks

Growth & margins
Revenue growth (YoY)
−14.5%

Higher than 13% of US stocks

Earnings growth (YoY)
−14.5%

Higher than 23% of US stocks

Gross margin
7.9%

Higher than 8% of US stocks

Operating margin
−72.5%

Higher than 15% of US stocks

Net margin
−226.5%

Higher than 2% of US stocks

Returns & dividend
Return on equity
−237.4%

Higher than 6% of US stocks

Return on assets
−45.2%

Higher than 9% of US stocks

Dividend yield

Bars mark the percentile across the ~4,600 US stocks Ticker Nerd covers, among those reporting the figure.

Peers

EP vs competitors

The nearest names by industry and size, scored by the same model — like for like.

Its peer group, ranked by the same modelOil & Gas E&P
CompanyMarket capTKN rank
EPEmpire Petroleum Corp.$109.8M
7
GLNDGreenland Energy Co.$94.6M
2
EPMEvolution Petroleum Corp.$129.4M
33
PEDPEDEVCO Corp.$148.4M
21
PROPPrairie Operating Co.$79.2M
72
ANNAAleAnna, Inc.$168.0M
52
AMPYAmplify Energy Corp.$168.4M
34

The rank is the raw material. Whether the rules would actually own Empire Petroleum Corp. — and when they’d sell — is the membership. See the Ticker Nerd 20 →

FAQ

Frequently asked questions about EP stock

How does Ticker Nerd's model rank EP?

As at 10 Aug 2026, Empire Petroleum Corp. ranks 7 out of 100 on Ticker Nerd's systematic factor model — a percentile across roughly 4,600 US stocks, built from its factor families. Its strongest factor family is Accruals (95 of 100).

What is the EP stock forecast for 2030?

No analyst covering Empire Petroleum Corp. publishes a 2030 price target — Wall Street targets run 12 to 18 months out. Sites quoting a 2030 price for EP are extrapolating price history, which says nothing about the business.

How has EP stock performed over the past year?

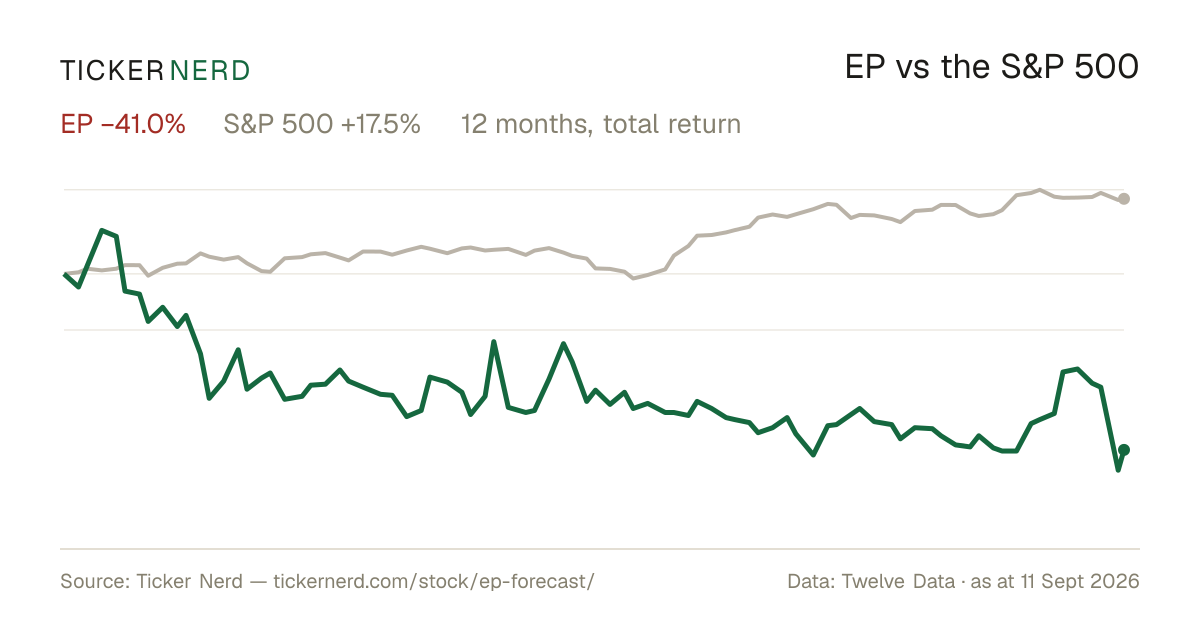
Empire Petroleum Corp. returned -42.5% over the 12 months to 11 Aug 2026, with dividends reinvested. Past performance does not indicate future returns.

What does Empire Petroleum Corp. do?

Empire Petroleum Corporation is an independent oil and natural gas firm that focuses on the exploration and production of hydrocarbons. Its primary function is to locate and extract crude oil and natural gas resources, which are vital components of the global energy supply chain.

Company

About Empire Petroleum Corp.

Empire Petroleum Corporation is an independent oil and natural gas firm that focuses on the exploration and production of hydrocarbons. Its primary function is to locate and extract crude oil and natural gas resources, which are vital components of the global energy supply chain. Empire Petroleum is engaged in both upstream activities, including the acquisition of oil and gas leasehold interests, and the operational development of these resources. The corporation primarily operates in established oil-rich regions, which may include U.S. states known for significant oil and gas reserves. Empire Petroleum's operations contribute to energy markets by expanding resource availability, thereby impacting industries reliant on oil and gas such as manufacturing, transportation, and utilities. The company's strategy often involves improving production efficiency and optimizing recovery, thus playing a crucial role in sustaining the energy needs of various sectors. As a player in the energy sector, Empire Petroleum Corporation holds significance in the financial market by participating in the supply side of the energy commodity trade, impacting pricing dynamics and energy-related investment portfolios.

CEO Mr. Michael R. Morrisett · 61 employees · United States · https://empirepetroleumcorp.com