EPMEPMEnergy · Oil & Gas E&P

EPM Stock Forecast: Evolution Petroleum Corp. Price Predictions for 2026-2027

Last close, 23 Oct 2026
$3.93
+4.52% on the day

The 4 Wall Street analysts covering Evolution Petroleum Corp. hold a median 12-month price target of $4.75 — +20.9% from the last close. Ticker Nerd's systematic factor model, run across ~4,600 US stocks, ranks it 46 of 100 as at 22 Oct 2026 — in the lower half.

Market cap
$151.0M
Ticker Nerd rank
46/ 100
Median analyst target
$4.75
Analysts covering
4
Revenue$20.2M−10.6% y/y
Operating income−$558K
Net income−$8.9M
Free cash flow−$2.4M
Quarterly, 8 quarters to 31 Mar 2026 · latest quarter's figure shown
Total return, dividends reinvested
1W
+5.9%
1M
+9.2%
YTD
+20.8%
1Y
−3.7%
From 52W high
−15.8%
From 52W low
+32.8%
$2.96
$4.67
52-week range, adjusted closes · the dot is the last close
Ticker Nerd rank

EPM stock analysis: one number for the whole business

Consensus tells you what everyone already believes. The model scores Evolution Petroleum Corp. on its factor families — the same systematic rank behind the Ticker Nerd portfolio.

Where the model ranks itAs at 22 Oct 2026
46/ 100

Percentile across ~4,600 US stocks on Ticker Nerd’s systematic factor model. Higher is better. How the model is built and tested

Revisions
85
Accruals
75
Size
69
Value
45
Volatility
41
Quality
37
Growth
35
Momentum
28
Issuance
18

Revisions (85): Analysts have, on balance, been raising their forecasts.

Issuance (18): The company has been issuing shares or taking on financing, diluting existing holders.

Built and run by Aslam Ghouse, an ex-Goldman Sachs quant trader with fourteen years in markets.

Wall Street

EPM stock forecast 2026-2027: analyst price targets & predictions

The bullish and bearish analyst opinions on EPM, reported as data — targets and ratings, the market's view beside the model's.

Share price and the analyst range, 12 monthsAdjusted close, US dollars
$3.00$4.00$5.00$6.00Jan 26Apr 26Jul 26Oct 26EPMHigh $6.00Median $4.75Low $4.50

Price targets and ratings are third-party analyst estimates, reported here as data. They are not Ticker Nerd forecasts, and they are frequently wrong.

Data provided by Twelve Data

What Wall Street says4 analysts
4 Buy0 Hold0 Sell
Low $4.50Median $4.75High $6.00

The green dot is the last close — the median target sits +20.9% from it.

Recent analyst actionsNewest first
DateFirmActionRatingTarget
22 Sept 2026Freedom BrokerUpgradeBuy—
28 Aug 2026Northland Capital MarketsUpgradeOutperform—
20 May 2026Freedom BrokerDowngradeHold—
24 Feb 2026Freedom BrokerMaintainsBuy—
23 Dec 2025Freedom BrokerInitiatesBuy—
23 Dec 2025Freedom Capital MarketsInitiatesBuy—
20 May 2025Northland Capital MarketsMaintainsMarket Perform—
23 Apr 2025Northland Capital MarketsDowngradeMarket Perform—
6 Feb 2025Northland Capital MarketsMaintainsOutperform—
4 Apr 2024Roth MKMMaintainsBuy—
18 Sept 2023Roth MKMReiteratesBuy—
10 Nov 2022Roth CapitalUpgradeBuy—
12 July 2022Northland Capital MarketsInitiatesOutperform—
6 July 2022Roth CapitalDowngradeNeutral—
5 Oct 2021Roth CapitalMaintainsBuy—
22 Apr 2021Roth CapitalMaintainsBuy—
4 Sept 2020Roth CapitalUpgradeBuy—
11 Feb 2019Roth CapitalUpgradeBuy—
15 Aug 2018Johnson RiceDowngradeHold—
23 July 2018Roth CapitalDowngradeNeutral—

Price targets and ratings are third-party analyst estimates, reported here as data. They are not Ticker Nerd forecasts, and they are frequently wrong.

Market Radar

This page is one stock. Monday covers all of them.

EPM appears in the Radar on the weeks it earns a place.

  • Market Radar, every Monday: the week's biggest rank moves across ~4,600 US stocks, and the reason for each.
  • The AI build-out map, free: every AI company we track, part by part, and one part in full with each verdict.
  • The AI build-out, every Wednesday: how AI stocks did, part by part.

Free. Unsubscribe any time.

Performance

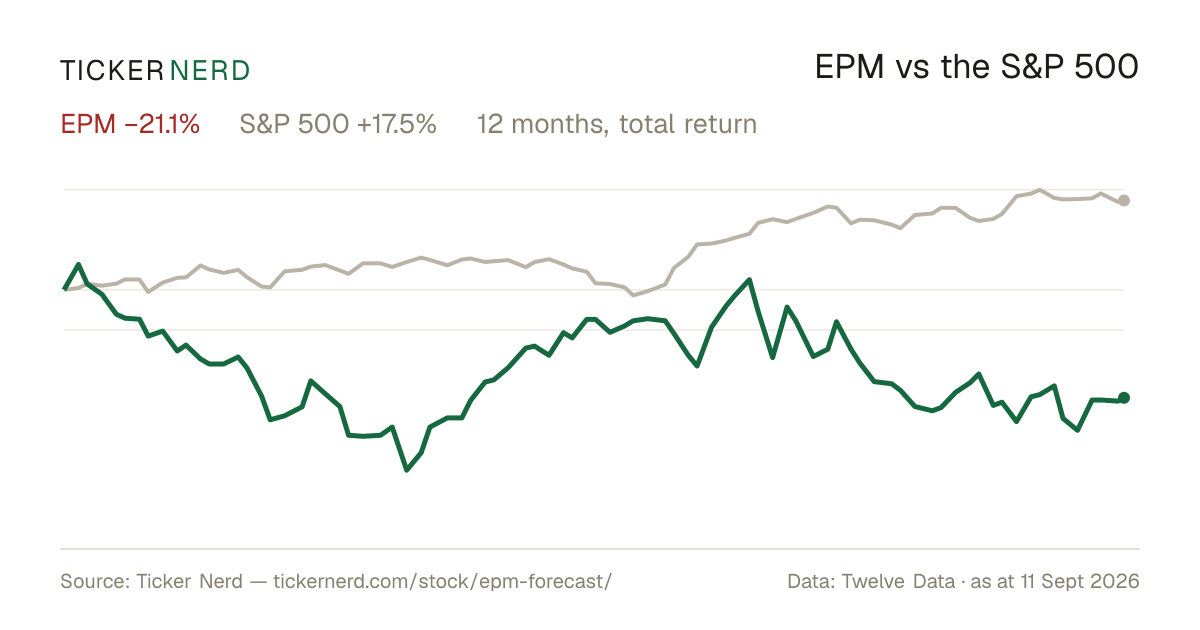
EPM vs the S&P 500

Both lines are total return — dividends reinvested — so the comparison is honest on both sides.

Over the twelve months to 23 Oct 2026, Evolution Petroleum Corp. returned −3.7% against +14.3% for the S&P 500, dividends included.

EPM vs S&P 500, last 12 monthsTotal return, rebased to 100
708090100110120Jan 26Apr 26Jul 26Oct 26EPMS&P 500

Download this chart as an image — free to reuse; link this page as the source.

Data provided by Twelve Data

Estimates

EPM analyst estimate revisions

Not the forecast itself — the direction analysts are revising it. Revision direction is one of the model's factor families.

Which way the estimates are movingNext fiscal year
EPS revision, 90 days
−10.3%
Analysts raising
3
Analysts cutting
1
Fundamentals

Evolution Petroleum Corp. (EPM) financial data

A margin means little on its own. Each bar marks where the figure sits across the whole US universe we score.

Valuation
Trailing P/E
59.9×

Cheaper than 12% of US stocks

Price / sales
1.7×

Cheaper than 55% of US stocks

Price / book
2.2×

Cheaper than 39% of US stocks

EV / EBITDA
8.5×

Cheaper than 43% of US stocks

Growth & margins
Revenue growth (YoY)
14.7%

Higher than 62% of US stocks

Earnings growth (YoY)
35.2%

Higher than 68% of US stocks

Gross margin
9.5%

Higher than 9% of US stocks

Operating margin
25.1%

Higher than 84% of US stocks

Net margin
−2.8%

Higher than 27% of US stocks

Returns & dividend
Return on equity
−3.7%

Higher than 40% of US stocks

Return on assets
0.2%

Higher than 44% of US stocks

Dividend yield
12.8%

Higher than 97% of US dividend payers

Bars mark the percentile across the ~4,600 US stocks Ticker Nerd covers, among those reporting the figure.

Key statistics

Evolution Petroleum Corp. (EPM) statistics: revenue, profit & scale

The headline figures, each with its date. Every row carries its own link — cite it straight from here.

  • Evolution Petroleum Corp. has a market value of $151.0M and an enterprise value of $199.1M.

  • Revenue in the twelve months to 31 Mar 2026: $83.2M. The latest quarter grew 14.7% year on year.

  • Net income over the same four quarters: −$3.6M, a −4.4% net margin.

  • Diluted earnings per share, trailing twelve months: $−0.11.

  • Free cash flow in the twelve months to 31 Mar 2026: −$13.4M, after $10.6M of capital spending.

  • Evolution Petroleum Corp. spent $405K on share buybacks and $16.7M on dividends in the twelve months to 31 Mar 2026.

  • Shares outstanding: 35.8M.

  • Trailing P/E: 59.9×; forward P/E: 37.6× — the forward figure prices analyst consensus estimates, not reported earnings.

  • Forward dividend yield: 12.81%, paying out 600% of earnings.

  • Evolution Petroleum Corp. employs 11 people — $7.6M of revenue per employee.

Statement figures: company filings via Twelve Data, four quarters to 31 Mar 2026 · market figures as at 22 Oct 2026

Data provided by Twelve Data

Peers

EPM vs competitors

The nearest names by industry and size, scored by the same model — like for like.

Its peer group, ranked by the same modelOil & Gas E&P
CompanyMarket capTKN rank
EPMEvolution Petroleum Corp.$151.0M46
ANNAAleAnna, Inc.$158.6M55
GLNDGreenland Energy Co.$129.3M5
EPEmpire Petroleum Corp.$128.1M18
AMPYAmplify Energy Corp.$179.3M43
EPSNEpsilon Energy Ltd.$184.1M40
PEDPEDEVCO Corp.$196.6M58

Look up any of the roughly 4,600 stocks we score.

The rank is the raw material. Whether the rules would actually own Evolution Petroleum Corp. — and when they’d sell — is the membership. See the Ticker Nerd 20 →

News

Latest EPM news & analysis

Evolution Petroleum: Capable Of Maintaining Its Dividend During FY 2027

Seeking Alpha · 22 Oct 2026positive

Evolution Petroleum acquired Midland Basin mineral and royalty interests, funded with $3.2 million in borrowings and 4.3 million common shares. The assets are expected to generate around 20% of the company’s asset-level free cash flow going forward.

Why it matters — The acquisition and expected cash-flow contribution are relevant to investors tracking EPM’s asset mix and ability to support its dividend.

Evolution Petroleum: A 13% Yield Worth A Small Bet

Seeking Alpha · 16 Oct 2026neutral

Seeking Alpha describes Evolution Petroleum's 13% yield as carrying higher risk than royalty peers because of elevated operating costs, weak FY2026 results, and dilution from a Permian acquisition. It says lower targeted capex and new royalties could improve cash flow and dividend coverage, while coverage remains tight.

Why it matters — EPM watchers may weigh the high yield and potential cash-flow improvement against elevated operating costs and currently tight dividend coverage.

Evolution Petroleum Eyes Dividend Growth With Midland Royalty Deal

MarketBeat · 5 Oct 2026positive

Evolution Petroleum Corp. stated its strategy remains focused on generating cash flow to support shareholder dividends while expanding its portfolio of non-operated working interests and mineral and royalty interests across multiple U.S. producing basins. The company is pursuing dividend growth through its Midland royalty deal.

Why it matters — An Evolution Petroleum watcher would care because the company affirms its commitment to dividend-supported cash flow and portfolio expansion across U.S. producing basins.

Evolution Petroleum Bets on Midland Royalties to Bolster Cash Flow and Dividend

MarketBeat · 28 Sept 2026positive

Evolution Petroleum outlined a strategy combining non-operated working interests with a growing mineral and royalty portfolio in the Midland Basin. Management said the approach is intended to support dividend payments, cash-flow resilience and selective growth investments.

Why it matters — The strategy signals how EPM plans to sustain its dividend and cash flow through royalty-focused assets, a key focus for shareholders.

Evolution Petroleum Eyes Cash-Flow Growth With Midland Basin Royalty Deal

MarketBeat · 27 Sept 2026positive

Evolution Petroleum presented its dividend-focused strategy, growing minerals and royalty portfolio, and recent Midland Basin acquisition during a company presentation led by executives including CEO Kelly Loyd, CFO Ryan Stash, and Director of Operations and Engineering Peter Pham.

Why it matters — The presentation highlights Evolution Petroleum's strategic focus on dividend returns and royalty growth, offering EPM watchers insight into the company's direction following its Midland Basin acquisition.

FAQ

Frequently asked questions about EPM stock

What is the EPM stock price forecast for 2026-2027?

The 4 Wall Street analysts covering Evolution Petroleum Corp. have a median 12-month price target of $4.75, with estimates ranging from $4.5 to $6. These are third-party analyst estimates, not Ticker Nerd forecasts, and they are frequently wrong.

Is EPM stock a buy right now?

Of the 4 analysts covering Evolution Petroleum Corp., 4 rate it a Buy, 0 a Hold and 0 a Sell. Ticker Nerd's systematic factor model ranks Evolution Petroleum Corp. 46 out of 100 across roughly 4,600 US stocks as at 22 Oct 2026. None of this is personal advice — it does not consider your circumstances.

How does Ticker Nerd's model rank EPM?

As at 22 Oct 2026, Evolution Petroleum Corp. ranks 46 out of 100 on Ticker Nerd's systematic factor model — a percentile across roughly 4,600 US stocks, built from its factor families. Its strongest factor family is Revisions (85 of 100).

Will EPM stock go up?

No one can know that. What the data says: the median 12-month target from 4 analysts implies +20.9% from the last close, and Ticker Nerd's factor model ranks Evolution Petroleum Corp. 46 out of 100 as at 22 Oct 2026. Analyst targets are third-party estimates and frequently wrong; none of this is personal advice.

What is the EPM stock forecast for 2030?

No analyst covering Evolution Petroleum Corp. publishes a 2030 price target — Wall Street targets run 12 to 18 months out. Sites quoting a 2030 price for EPM are extrapolating price history, which says nothing about the business. The furthest attributed numbers are the current analyst targets: $4.5 to $6 over the next 12 months.

How has EPM stock performed over the past year?

Evolution Petroleum Corp. returned -3.7% over the 12 months to 23 Oct 2026, with dividends reinvested. Past performance does not indicate future returns.

What does Evolution Petroleum Corp. do?

Evolution Petroleum Corporation, Inc. is an independent oil and natural gas company focused on the acquisition, development, and optimization of onshore producing properties in the United States.

What is the latest news on EPM?

The most recent item we track (Seeking Alpha, 22 Oct 2026): "Evolution Petroleum: Capable Of Maintaining Its Dividend During FY 2027". Evolution Petroleum acquired Midland Basin mineral and royalty interests, funded with $3.2 million in borrowings and 4.3 million common shares. The assets are expected to generate around 20% of the company’s asset-level free cash flow going forward.

Company

About Evolution Petroleum Corp.

Evolution Petroleum Corporation, Inc. is an independent oil and natural gas company focused on the acquisition, development, and optimization of onshore producing properties in the United States. The company concentrates on mature reservoirs and enhanced recovery operations, including carbon dioxide-based projects and non-operated interests across established oil and gas basins. Its portfolio spans assets in Louisiana, Wyoming, North Dakota, Texas, New Mexico, and Oklahoma, supporting production from crude oil, natural gas, and associated hydrocarbons. Evolution Petroleum Corporation, Inc. plays a specialized role in the energy market by managing long-life fields, applying reservoir engineering expertise, and seeking efficient recovery from existing assets rather than large-scale frontier exploration. Headquartered in Houston, Texas, and founded in 2003, the company serves as a focused upstream energy producer with exposure to multiple U.S. hydrocarbon regions.

CEO Mr. Kelly W. Loyd · 11 employees · United States · https://www.evolutionpetroleum.com