BUUUBUUUIndustrials · Specialty Business Services

BUUU Stock Forecast: BUUU Group Ltd. Price Predictions for 2026-2027

Last close, 3 Aug 2026
$22
−2.97% on the day

Ticker Nerd's systematic factor model, run across ~4,600 US stocks, ranks it 1 of 100 as at 1 Aug 2026 — in the weakest quartile.

Market cap
$376.8M
Ticker Nerd rank
1 / 100
Median analyst target
Analysts covering
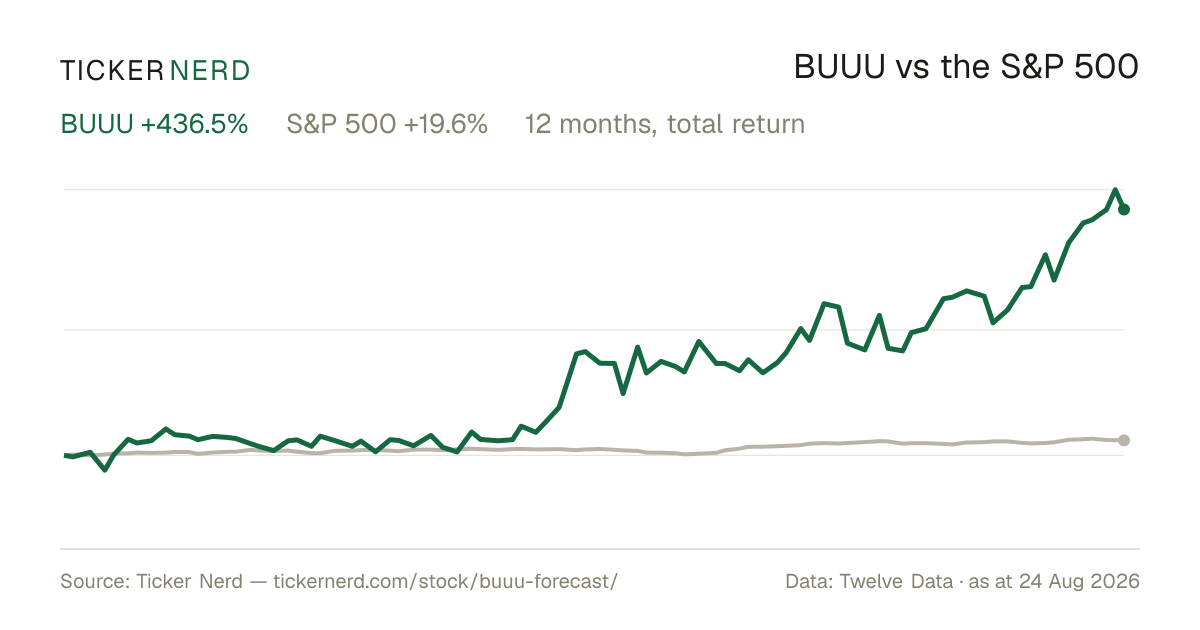
Total return, dividends reinvested
1W
−4.7%
1M
+0.5%
YTD
+241.1%
From high
−11.9%
From low
+447.5%
$4
$25
Range since 14 Aug 2025, adjusted closes · the dot is the last close
Ticker Nerd rank

BUUU stock analysis: one number for the whole business

Consensus tells you what everyone already believes. The model scores BUUU Group Ltd. on its factor families — the same systematic rank behind the Ticker Nerd portfolio.

Where the model ranks itAs at 1 Aug 2026
1 / 100

Percentile across ~4,600 US stocks on Ticker Nerd’s systematic factor model. Higher is better. How the model is built and tested

Size
57
Revisions
25
Momentum
24
Accruals
8
Value
7
Volatility
6
Issuance
5
Growth
3
Quality
2

Size (57): Smaller than most of the companies we track.

Quality (2): Profits are thin or unreliable for the size of the business, or they are not turning into cash.

The rank is the raw material. Whether the rules would actually own BUUU Group Ltd. — and when they’d sell — is the membership.

Wall Street

BUUU stock forecast 2026-2027: analyst price targets & predictions

The bullish and bearish analyst opinions on BUUU, reported as data — targets and ratings, the market's view beside the model's.

Share price and the analyst range, since 14 Aug 2025Adjusted close, US dollars
$5$10$15$20$25Oct 25Jan 26Apr 26Jul 26BUUU

Price targets and ratings are third-party analyst estimates, reported here as data. They are not Ticker Nerd forecasts, and they are frequently wrong.

Price targets and ratings are third-party analyst estimates, reported here as data. They are not Ticker Nerd forecasts, and they are frequently wrong.

Estimates

BUUU analyst estimate revisions

Not the forecast itself — the direction analysts are revising it. Revision direction is one of the model's factor families.

Fundamentals

BUUU Group Ltd. (BUUU) financial data

A margin means little on its own. Each bar marks where the figure sits across the whole US universe we score.

Valuation
Trailing P/E
244.3×

Cheaper than 3% of US stocks

Price / sales
56.4×

Cheaper than 5% of US stocks

Price / book
61.8×

Cheaper than 2% of US stocks

EV / EBITDA
−9811.2×

Cheaper than 99% of US stocks

Growth & margins
Revenue growth (YoY)
12.3%

Higher than 60% of US stocks

Earnings growth (YoY)
Gross margin
Operating margin
−27.4%

Higher than 21% of US stocks

Net margin
−4.0%

Higher than 25% of US stocks

Returns & dividend
Return on equity
−7.2%

Higher than 37% of US stocks

Return on assets
−1.0%

Higher than 40% of US stocks

Dividend yield

Bars mark the percentile across the ~4,600 US stocks Ticker Nerd covers, among those reporting the figure.

Peers

BUUU vs competitors

The nearest names by industry and size, scored by the same model — like for like.

Its peer group, ranked by the same modelSpecialty Business Services
CompanyMarket capTKN rank
BUUUBUUU Group Ltd.$376.8M
1
SPIRSpire Global, Inc.$460.9M
54
QUADQuad/Graphics, Inc.$529.1M
100
CASSCass Information Systems, Inc.$731.7M
69
TRNSTranscat, Inc.$799.0M
33
KODKEastman Kodak Co.$809.8M
76
BKSYBlacksky Technology, Inc.$943.2M
17
Market Radar

This page is one stock. Monday covers all of them.

Computed off the Friday close and sent before the US open.

Market Radar reports the week’s largest rank changes across roughly 4,600 US stocks, the factor behind each one, and where the market went. BUUU appears on the weeks it earns a place.

Free, every Monday. Unsubscribe any time.

FAQ

Frequently asked questions about BUUU stock

How does Ticker Nerd's model rank BUUU?

As at 1 Aug 2026, BUUU Group Ltd. ranks 1 out of 100 on Ticker Nerd's systematic factor model — a percentile across roughly 4,600 US stocks, built from its factor families. Its strongest factor family is Size (57 of 100).

What is the BUUU stock forecast for 2030?

No analyst covering BUUU Group Ltd. publishes a 2030 price target — Wall Street targets run 12 to 18 months out. Sites quoting a 2030 price for BUUU are extrapolating price history, which says nothing about the business.

What does BUUU Group Ltd. do?

BUUU Group Limited is a provider of meetings, incentives, conferences, and exhibitions (MICE) solutions operating in the specialty business services sector. The company delivers comprehensive event management and stage production services through its subsidiaries.

Company

About BUUU Group Ltd.

BUUU Group Limited is a provider of meetings, incentives, conferences, and exhibitions (MICE) solutions operating in the specialty business services sector. The company delivers comprehensive event management and stage production services through its subsidiaries. In event management, it curates and organizes a variety of events such as cultural, artistic, recreational activities, and corporate promotions. Its stage production capabilities include technical direction, fabrication, and installation of set elements to support live events. BUUU Group Limited serves diverse clients, including public institutions, commercial organizations like marketing and public relations firms, real estate corporations, and established brands. These services facilitate professional execution of large-scale gatherings, corporate functions, and promotional activities. Founded in 2017 and headquartered in Cheung Sha Wan, Hong Kong, with a holding company incorporated in the British Virgin Islands, BUUU Group Limited plays a key role in the MICE industry by enabling seamless event planning and production for institutional and business needs across various sectors.

CEO Mr. Wai Kwong Poon · 16 employees · Hong Kong · https://bucreation.com