CISOCISOTechnology · Software - Infrastructure

CISO Stock Forecast: CISO Global, Inc. Price Predictions for 2026-2027

Last close, 18 Sept 2026
$0.25
+1.63% on the day

Ticker Nerd's systematic factor model, run across ~4,600 US stocks, ranks it 37 of 100 as at 19 Sept 2026 — in the lower half.

Market cap
$11.3M
Ticker Nerd rank
37 / 100
Median analyst target
Analysts covering
0
Revenue$5.8M−13.7% y/y
Operating income−$1.5M
Net income−$1.6M
Free cash flow−$69K
Quarterly, 8 quarters to 30 June 2026 · latest quarter's figure shown
Total return, dividends reinvested
1W
+6.4%
1M
−2.7%
YTD
−48.1%
1Y
−79.6%
From 52W high
−82.2%
From 52W low
+16.9%
$0.21
$1.40
52-week range, adjusted closes · the dot is the last close
Ticker Nerd rank

CISO stock analysis: one number for the whole business

Consensus tells you what everyone already believes. The model scores CISO Global, Inc. on its factor families — the same systematic rank behind the Ticker Nerd portfolio.

Where the model ranks itAs at 19 Sept 2026
37 / 100

Percentile across ~4,600 US stocks on Ticker Nerd’s systematic factor model. Higher is better. How the model is built and tested

Size
92
Accruals
79
Issuance
64
Quality
57
Growth
47
Volatility
28
Revisions
25
Value
22
Momentum
8

Size (92): Smaller than most of the companies we track.

Momentum (8): The shares have been drifting down relative to others.

Built and run by Aslam Ghouse, an ex-Goldman Sachs quant trader with fourteen years in markets.

Wall Street

CISO stock forecast 2026-2027: analyst price targets & predictions

The bullish and bearish analyst opinions on CISO, reported as data — targets and ratings, the market's view beside the model's.

Share price and the analyst range, 12 monthsAdjusted close, US dollars
$0.20$0.40$0.60$0.80$1.00$1.20$1.40Oct 25Jan 26Apr 26Jul 26CISO

Price targets and ratings are third-party analyst estimates, reported here as data. They are not Ticker Nerd forecasts, and they are frequently wrong.

Data provided by Twelve Data

Recent analyst actionsNewest first
DateFirmActionRatingTarget
21 Oct 2022Cantor FitzgeraldInitiatesOverweight$5.00

Price targets and ratings are third-party analyst estimates, reported here as data. They are not Ticker Nerd forecasts, and they are frequently wrong.

Market Radar

This page is one stock. Monday covers all of them.

Computed off the Friday close and sent before the US open.

Market Radar reports the week’s largest rank changes across roughly 4,600 US stocks, the factor behind each one, and where the market went. CISO appears on the weeks it earns a place.

Free, every Monday. Unsubscribe any time.

Performance

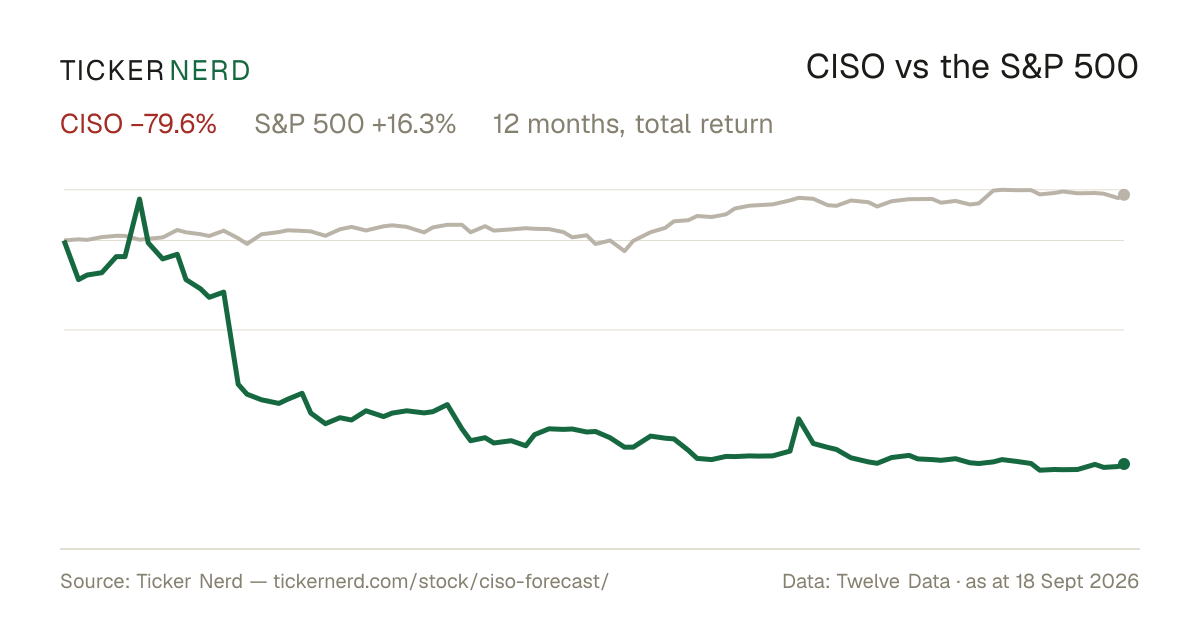
CISO vs the S&P 500

Both lines are total return — dividends reinvested — so the comparison is honest on both sides.

Over the twelve months to 18 Sept 2026, CISO Global, Inc. returned −79.6% against +16.3% for the S&P 500, dividends included.

CISO vs S&P 500, last 12 monthsTotal return, rebased to 100
20406080100120Oct 25Jan 26Apr 26Jul 26CISOS&P 500

Download this chart as an image — free to reuse; link this page as the source.

Data provided by Twelve Data

Estimates

CISO analyst estimate revisions

Not the forecast itself — the direction analysts are revising it. Revision direction is one of the model's factor families.

Fundamentals

CISO Global, Inc. (CISO) financial data

A margin means little on its own. Each bar marks where the figure sits across the whole US universe we score.

Valuation
Trailing P/E
6.3×

Cheaper than 64% of US stocks

Price / sales
0.5×

Cheaper than 83% of US stocks

Price / book
0.9×

Cheaper than 75% of US stocks

EV / EBITDA
−2.3×

Cheaper than 73% of US stocks

Growth & margins
Revenue growth (YoY)
−13.7%

Higher than 13% of US stocks

Earnings growth (YoY)
−13.7%

Higher than 24% of US stocks

Gross margin
24.6%

Higher than 27% of US stocks

Operating margin
−25.7%

Higher than 20% of US stocks

Net margin
−11.7%

Higher than 19% of US stocks

Returns & dividend
Return on equity
−28.8%

Higher than 27% of US stocks

Return on assets
−19.4%

Higher than 20% of US stocks

Dividend yield

Bars mark the percentile across the ~4,600 US stocks Ticker Nerd covers, among those reporting the figure.

Key statistics

CISO Global, Inc. (CISO) statistics: revenue, profit & scale

The headline figures, each with its date. Every row carries its own link — cite it straight from here.

  • CISO Global, Inc. has a market value of $11.3M and an enterprise value of $15.1M.

  • Revenue in the twelve months to 30 June 2026: $24.7M. The latest quarter shrank 13.7% year on year.

  • Net income over the same four quarters: −$2.9M, a −11.7% net margin.

  • Free cash flow in the twelve months to 30 June 2026: −$3.6M.

  • Shares outstanding: 45.5M.

  • Trailing P/E: 6.3×; forward P/E: −1.5× — the forward figure prices analyst consensus estimates, not reported earnings.

  • CISO Global, Inc. employs 125 people $198K of revenue per employee.

Statement figures: company filings via Twelve Data, four quarters to 30 June 2026 · market figures as at 20 Sept 2026

Data provided by Twelve Data

Peers

CISO vs competitors

The nearest names by industry and size, scored by the same model — like for like.

Its peer group, ranked by the same modelSoftware - Infrastructure
CompanyMarket capTKN rank
CISOCISO Global, Inc.$11.3M
37
HPAIHelport AI Ltd.$11.1M
25
BLINBridgeline Digital, Inc.$10.7M
57
GYGYGame Your Game, Inc.$12.4M
1
GIXIGix Internet Ltd.$13.8M
25
BTLNBrightline Interactive, Inc.$14.1M
29
DTSSDatasea Intelligent Technology Ltd.$14.3M
40

Look up any of the roughly 4,600 stocks we score.

The rank is the raw material. Whether the rules would actually own CISO Global, Inc. — and when they’d sell — is the membership. See the Ticker Nerd 20 →

FAQ

Frequently asked questions about CISO stock

How does Ticker Nerd's model rank CISO?

As at 19 Sept 2026, CISO Global, Inc. ranks 37 out of 100 on Ticker Nerd's systematic factor model — a percentile across roughly 4,600 US stocks, built from its factor families. Its strongest factor family is Size (92 of 100).

What is the CISO stock forecast for 2030?

No analyst covering CISO Global, Inc. publishes a 2030 price target — Wall Street targets run 12 to 18 months out. Sites quoting a 2030 price for CISO are extrapolating price history, which says nothing about the business.

How has CISO stock performed over the past year?

CISO Global, Inc. returned -79.6% over the 12 months to 18 Sept 2026, with dividends reinvested. Past performance does not indicate future returns.

What does CISO Global, Inc. do?

CISO Global Inc. is a cybersecurity, compliance, and software company that provides services designed to help organizations protect digital assets, manage risk, and meet regulatory requirements.

Company

About CISO Global, Inc.

CISO Global Inc. is a cybersecurity, compliance, and software company that provides services designed to help organizations protect digital assets, manage risk, and meet regulatory requirements. CISO Global’s offerings include managed security services, compliance monitoring, cyber defense operations, incident response, digital forensics, vulnerability assessments, penetration testing, and disaster recovery support. The company also delivers cybersecurity consulting, technical assessments, and professional services that help clients strengthen security operations and improve resilience. In addition, CISO Global develops and provides software-enabled tools that support threat detection, security oversight, and secure IT administration. The company serves organizations across regulated and high-risk industries, including finance, healthcare, manufacturing, government, critical infrastructure, and technology. Headquartered in Scottsdale, Arizona, CISO Global plays a specialized role in the market as a provider of integrated cybersecurity and compliance solutions for businesses operating in complex digital environments.

CEO Mr. David G. Jemmett · 125 employees · United States · https://www.ciso.inc