CWENCWENUtilities · Utilities - Renewable

CWEN Stock Forecast: Clearway Energy, Inc. Price Predictions for 2026-2027

Last close, 3 Sept 2026
$31
+0.16% on the day

The 12 Wall Street analysts covering Clearway Energy, Inc. hold a median 12-month price target of $43 — +35.0% from the last close. Ticker Nerd's systematic factor model, run across ~4,600 US stocks, ranks it 26 of 100 as at 2 Sept 2026 — in the lower half. The Street sees upside; the factor read is a caution. That gap is the story on this page.

Market cap
$7.7B
Ticker Nerd rank
26 / 100
Median analyst target
$43
Analysts covering
12
Revenue$481.0M+22.7% y/y
Operating income$121.0M
Net income$30.0M
Free cash flow$88.0M
Quarterly, 8 quarters to 30 June 2026 · latest quarter's figure shown
Total return, dividends reinvested
1W
−1.4%
1M
−0.4%
YTD
−1.7%
1Y
+15.5%
From 52W high
−22.6%
From 52W low
+18.7%
$27
$41
52-week range, adjusted closes · the dot is the last close
Ticker Nerd rank

CWEN stock analysis: one number for the whole business

Consensus tells you what everyone already believes. The model scores Clearway Energy, Inc. on its factor families — the same systematic rank behind the Ticker Nerd portfolio.

Where the model ranks itAs at 2 Sept 2026
26 / 100

Percentile across ~4,600 US stocks on Ticker Nerd’s systematic factor model. Higher is better. How the model is built and tested

Growth
52
Accruals
52
Revisions
51
Momentum
45
Value
42
Quality
41
Issuance
30
Volatility
26
Size
20

Growth (52): Sales and profits are climbing, and climbing faster than before.

Volatility (26): The share price moves around a lot.

Size (20): Larger than most of the companies we track — more scrutinised, less often mispriced.

Built and run by Aslam Ghouse, an ex-Goldman Sachs quant trader with fourteen years in markets.

Wall Street

CWEN stock forecast 2026-2027: analyst price targets & predictions

The bullish and bearish analyst opinions on CWEN, reported as data — targets and ratings, the market's view beside the model's.

Share price and the analyst range, 12 monthsAdjusted close, US dollars
$20$30$40$50$60Oct 25Jan 26Apr 26Jul 26CWENHigh $58Median $43Low $34

Price targets and ratings are third-party analyst estimates, reported here as data. They are not Ticker Nerd forecasts, and they are frequently wrong.

Data provided by Twelve Data

What Wall Street says12 analysts
11 Buy1 Hold0 Sell
Low $34Median $43High $58

The green dot is the last close — the median target sits +35.0% from it.

Recent analyst actionsNewest first
DateFirmActionRatingTarget
18 Aug 2026Morgan StanleyMaintainsOverweight$60$58
17 Aug 2026Evercore ISI GroupMaintainsIn-Line$39$40
14 July 2026Truist SecuritiesInitiatesBuy
14 July 2026Truist SecuritiesInitiatesBuy$43
24 June 2026UBSMaintainsBuy
27 May 2026Morgan StanleyMaintainsOverweight
24 Mar 2026UBSMaintainsBuy
5 Mar 2026Evercore ISI GroupMaintainsIn-Line
24 Feb 2026RBC CapitalMaintainsOutperform
24 Feb 2026Roth CapitalReiteratesBuy
17 Dec 2025CIBCUpgradeOutperformer
2 Dec 2025Morgan StanleyMaintainsOverweight
24 Nov 2025Roth CapitalMaintainsBuy
5 Nov 2025Roth CapitalReiteratesBuy
21 Oct 2025CIBCMaintainsNeutral
8 Oct 2025RBC CapitalInitiatesOutperform
7 Oct 2025Evercore ISI GroupInitiatesIn-Line
23 July 2025JefferiesMaintainsBuy
21 July 2025CIBCDowngradeNeutral
25 Mar 2025Deutsche BankInitiatesBuy

Price targets and ratings are third-party analyst estimates, reported here as data. They are not Ticker Nerd forecasts, and they are frequently wrong.

Market Radar

This page is one stock. Monday covers all of them.

Computed off the Friday close and sent before the US open.

Market Radar reports the week’s largest rank changes across roughly 4,600 US stocks, the factor behind each one, and where the market went. CWEN appears on the weeks it earns a place.

Free, every Monday. Unsubscribe any time.

Performance

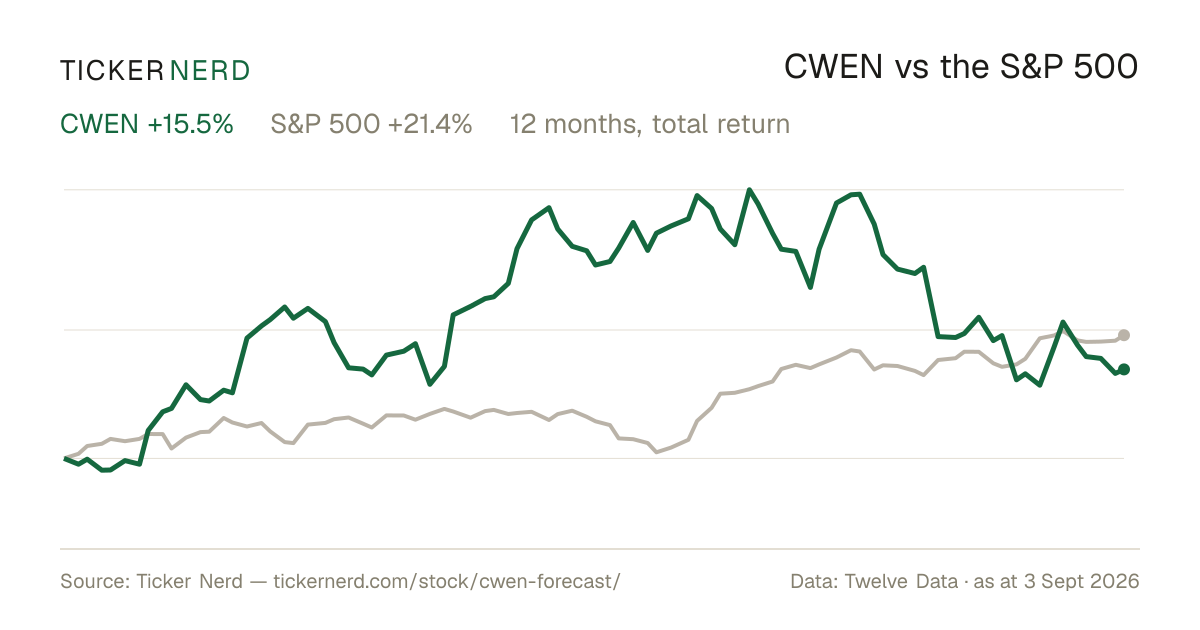
CWEN vs the S&P 500

Both lines are total return — dividends reinvested — so the comparison is honest on both sides.

Over the twelve months to 3 Sept 2026, Clearway Energy, Inc. returned +15.5% against +21.4% for the S&P 500, dividends included.

CWEN vs S&P 500, last 12 monthsTotal return, rebased to 100
90100110120130140150Oct 25Jan 26Apr 26Jul 26CWENS&P 500

Download this chart as an image — free to reuse; link this page as the source.

Data provided by Twelve Data

Estimates

CWEN analyst estimate revisions

Not the forecast itself — the direction analysts are revising it. Revision direction is one of the model's factor families.

Which way the estimates are movingNext fiscal year
EPS revision, 90 days
+63.9%
Analysts raising
0
Analysts cutting
1
Fundamentals

Clearway Energy, Inc. (CWEN) financial data

A margin means little on its own. Each bar marks where the figure sits across the whole US universe we score.

Valuation
Trailing P/E
36.6×

Cheaper than 21% of US stocks

Price / sales
4.9×

Cheaper than 25% of US stocks

Price / book
2.1×

Cheaper than 45% of US stocks

EV / EBITDA
14.7×

Cheaper than 24% of US stocks

Growth & margins
Revenue growth (YoY)
22.7%

Higher than 72% of US stocks

Earnings growth (YoY)
306.7%

Higher than 93% of US stocks

Gross margin
69.0%

Higher than 82% of US stocks

Operating margin
25.2%

Higher than 84% of US stocks

Net margin
6.4%

Higher than 63% of US stocks

Returns & dividend
Return on equity
−3.2%

Higher than 41% of US stocks

Return on assets
1.0%

Higher than 49% of US stocks

Dividend yield
6.0%

Higher than 85% of US dividend payers

Bars mark the percentile across the ~4,600 US stocks Ticker Nerd covers, among those reporting the figure.

Key statistics

Clearway Energy, Inc. (CWEN) statistics: revenue, profit & scale

The headline figures, each with its date. Every row carries its own link — cite it straight from here.

  • Clearway Energy, Inc. has a market value of $7.7B and an enterprise value of $17.2B.

  • Revenue in the twelve months to 30 June 2026: $1.6B. The latest quarter grew 22.7% year on year.

  • Net income over the same four quarters: −$177.0M, a −11.2% net margin.

  • Free cash flow in the twelve months to 30 June 2026: $532.0M, after $346.0M of capital spending.

  • Clearway Energy, Inc. spent $372.0M on dividends in the twelve months to 30 June 2026.

  • Shares outstanding: 205.3M.

  • Trailing P/E: 36.6×; forward P/E: 15.2× — the forward figure prices analyst consensus estimates, not reported earnings.

  • Forward dividend yield: 6.04%, paying out 212% of earnings.

  • Clearway Energy, Inc. employs 60 people $26.2M of revenue per employee.

Statement figures: company filings via Twelve Data, four quarters to 30 June 2026 · market figures as at 3 Sept 2026

Data provided by Twelve Data

Peers

CWEN vs competitors

The nearest names by industry and size, scored by the same model — like for like.

Its peer group, ranked by the same modelUtilities - Renewable
CompanyMarket capTKN rank
CWENClearway Energy, Inc.$7.7B
26
ORAOrmat Technologies, Inc.$6.4B
34
BEPCBrookfield Renewable Corp.$5.6B
9
FRVOFervo Energy Co.$5.3B
0
MWHSOLV Energy, Inc.$5.1B
2
ENLTEnlight Renewable Energy Ltd.$10.6B
18
RNWReNew Energy Global Plc$2.5B
40

Look up any of the roughly 4,600 stocks we score.

The rank is the raw material. Whether the rules would actually own Clearway Energy, Inc. — and when they’d sell — is the membership. See the Ticker Nerd 20 →

News

Latest CWEN news & analysis

Nobody's Talking About This Energy Company, but It's Quietly Signing the Power Deals Feeding the AI Build-Out

The Motley Fool · 29 Aug 2026positive

Clearway Energy's parent company recently agreed to build additional power for Google, which it will eventually transfer to its Clearway affiliate. Clearway also signed new power purchase agreements with hyperscalers at notably higher rates than its prior arrangements.

Why it matters — CWEN watchers would care because these new agreements point to rising demand for Clearway's power from AI-driven hyperscalers and higher contracted rates feeding into its affiliate.

Why I Am A Dividend Growth Investor (At Age 35)

Seeking Alpha · 29 Aug 2026neutral

An investor describes a dividend growth investing strategy, building a core portfolio of dividend growth ETFs and high-quality individual stocks for stability and passive income. The approach favors continuity and flexibility over abrupt transitions from growth to dividend stocks near retirement.

Why it matters — CWEN watchers may find this relevant as it reflects the broader investor preference for dividend growth stocks, a category in which Clearway Energy participates.

18 LoPrice/HiYield DiviDogs Rated Buys For August

Seeking Alpha · 27 Aug 2026neutral

A Seeking Alpha article screened the Russell 3000 for dividend-paying stocks yielding between 5% and 25% and priced between $5 and $65 per share, identifying a collection of 37 "LoPrice/HiYield DiviDogs" of which 18 were rated as buys for August. The piece reproduces guidance suggesting investors seek companies with consistent profits, good cash flow, and other quality indicators.

Why it matters — CWEN watchers may find relevance because the report screens high-yield dividend stocks in the price range where such yield-focused, income-oriented equities are evaluated, though Clearway Energy is not specifically mentioned.

Clearway Energy: Staying The Course

Seeking Alpha · 14 Aug 2026positive

Seeking Alpha's "Clearway Energy: Staying The Course" article keeps a Buy rating on Clearway Energy, highlighting the company's contracted renewable and conventional assets, a recently simplified capital structure, and a dividend yield that exceeds bond yields and is well covered by CAFD. Management targets $2.90–$3.10 CAFD per share by 2030, supported by its project pipeline and disciplined capital allocation.

Why it matters — A CWEN watcher would care because the article affirms the company's yield-and-growth positioning and the strength of its dividend coverage and long-term CAFD outlook.

Green Dividends: 2 Renewable Energy Compounders To Beat Inflation

Seeking Alpha · 14 Aug 2026positive

The article suggests power demand could surge for decades and that renewables may remain major beneficiaries, highlighting two dividend-growing renewable energy companies as a way for investors to profit amid inflation.

Why it matters — CWEN watchers would care because the piece frames renewable energy dividend growers as well-positioned to benefit from sustained long-term power demand growth.

FAQ

Frequently asked questions about CWEN stock

What is the CWEN stock price forecast for 2026-2027?

The 12 Wall Street analysts covering Clearway Energy, Inc. have a median 12-month price target of $43, with estimates ranging from $34 to $58. These are third-party analyst estimates, not Ticker Nerd forecasts, and they are frequently wrong.

Is CWEN stock a buy right now?

Of the 12 analysts covering Clearway Energy, Inc., 11 rate it a Buy, 1 a Hold and 0 a Sell. Ticker Nerd's systematic factor model ranks Clearway Energy, Inc. 26 out of 100 across roughly 4,600 US stocks as at 2 Sept 2026. None of this is personal advice — it does not consider your circumstances.

How does Ticker Nerd's model rank CWEN?

As at 2 Sept 2026, Clearway Energy, Inc. ranks 26 out of 100 on Ticker Nerd's systematic factor model — a percentile across roughly 4,600 US stocks, built from its factor families. Its strongest factor family is Growth (52 of 100).

Will CWEN stock go up?

No one can know that. What the data says: the median 12-month target from 12 analysts implies +35.0% from the last close, and Ticker Nerd's factor model ranks Clearway Energy, Inc. 26 out of 100 as at 2 Sept 2026. Analyst targets are third-party estimates and frequently wrong; none of this is personal advice.

What is the CWEN stock forecast for 2030?

No analyst covering Clearway Energy, Inc. publishes a 2030 price target — Wall Street targets run 12 to 18 months out. Sites quoting a 2030 price for CWEN are extrapolating price history, which says nothing about the business. The furthest attributed numbers are the current analyst targets: $34 to $58 over the next 12 months.

How has CWEN stock performed over the past year?

Clearway Energy, Inc. returned +15.5% over the 12 months to 3 Sept 2026, with dividends reinvested. Past performance does not indicate future returns.

What does Clearway Energy, Inc. do?

Clearway Energy Inc. Class C Common Stock represents an equity interest in Clearway Energy, a U.S.

What is the latest news on CWEN?

The most recent item we track (The Motley Fool, 29 Aug 2026): "Nobody's Talking About This Energy Company, but It's Quietly Signing the Power Deals Feeding the AI Build-Out". Clearway Energy's parent company recently agreed to build additional power for Google, which it will eventually transfer to its Clearway affiliate. Clearway also signed new power purchase agreements with hyperscalers at notably higher rates than its prior arrangements.

Company

About Clearway Energy, Inc.

Clearway Energy Inc. Class C Common Stock represents an equity interest in Clearway Energy, a U.S. energy company focused on contracted power generation and related infrastructure. Clearway Energy owns and operates a diversified portfolio of renewable and conventional assets, including wind, solar, battery energy storage, natural gas-fired generation, and thermal infrastructure. The company’s business is organized around renewable energy and flexible generation, providing electricity supply and grid-support services to utilities, businesses, and other energy market participants. Clearway Energy’s asset base is designed to generate stable cash flows from long-term contracted arrangements while serving the ongoing demand for dependable power across multiple U.S. markets. As a publicly traded Class C share, it gives investors access to a utility-like energy infrastructure platform with exposure to both clean energy production and dispatchable generation assets.

CEO Mr. Craig Cornelius · 60 employees · United States · https://investor.clearwayenergy.com