FRVOUtilities · Utilities - Renewable

FRVO Stock Forecast: Fervo Energy Co. Price Predictions for 2026-2027

Last close, 14 Oct 2026
$11
−8.68% on the day

The 14 Wall Street analysts covering Fervo Energy Co. hold a median 12-month price target of $37 — +238.2% from the last close. Ticker Nerd's systematic factor model, run across ~4,600 US stocks, ranks it 0 of 100 as at 14 Oct 2026 — in the weakest quartile. The Street sees upside; the factor read is a caution. That gap is the story on this page.

Market cap
$3.5B
Ticker Nerd rank
0 / 100
Median analyst target
$37
Analysts covering
14
Revenue$113K
Operating income−$28.7M
Net income−$55.9M
Free cash flow−$261.2M
Quarterly, 4 quarters to 30 June 2026 · latest quarter's figure shown
Total return, dividends reinvested
1W
−21.7%
1M
−26.9%
From high
−74.3%
From low
0.0%
$11
$43
Range since 13 May 2026, adjusted closes · the dot is the last close
Ticker Nerd rank

FRVO stock analysis: one number for the whole business

Consensus tells you what everyone already believes. The model scores Fervo Energy Co. on its factor families — the same systematic rank behind the Ticker Nerd portfolio.

Where the model ranks itAs at 14 Oct 2026
0 / 100

Percentile across ~4,600 US stocks on Ticker Nerd’s systematic factor model. Higher is better. How the model is built and tested

Revisions
36
Size
28
Accruals
8
Issuance
4
Momentum
0
Quality
0
Volatility
0
Value
0
Growth
0

Revisions (36): Analysts have, on balance, been raising their forecasts.

Growth (0): Sales and profits are flat, shrinking, or growing more slowly than they were.

Built and run by Aslam Ghouse, an ex-Goldman Sachs quant trader with fourteen years in markets.

Wall Street

FRVO stock forecast 2026-2027: analyst price targets & predictions

The bullish and bearish analyst opinions on FRVO, reported as data — targets and ratings, the market's view beside the model's.

Share price and the analyst range, since 13 May 2026Adjusted close, US dollars
$10$20$30$40$50Jun 26Jul 26Aug 26Sep 26Oct 26FRVOHigh $51Median $37Low $25

Price targets and ratings are third-party analyst estimates, reported here as data. They are not Ticker Nerd forecasts, and they are frequently wrong.

Data provided by Twelve Data

What Wall Street says14 analysts
14 Buy0 Hold0 Sell
Low $25Median $37High $51

The green dot is the last close — the median target sits +238.2% from it.

Recent analyst actionsNewest first

Of the 20 most recent actions, 2 moved their price target up and 4 moved it down.

DateFirmActionRatingTarget
2 Oct 2026BernsteinReiteratesOutperform$47
25 Sept 2026B of A SecuritiesMaintainsBuy$36 → $30
25 Sept 2026Wolfe ResearchUpgradeOutperform$29
24 Sept 2026BernsteinReiteratesOutperform—
24 Sept 2026BernsteinReiteratesOutperform$47
24 Sept 2026Johnson RiceInitiatesBuy$35
24 Sept 2026Johnson RiceInitiatesBuy—
10 Sept 2026Northland Capital MarketsInitiatesOutperform—
10 Sept 2026Northland Capital MarketsInitiatesOutperform$27
13 Aug 2026BairdMaintainsOutperform$50 → $35
13 Aug 2026BairdMaintainsOutperform—
20 July 2026JefferiesUpgradeBuy—
20 July 2026JefferiesUpgradeBuy$41 → $34
17 July 2026B of A SecuritiesUpgradeBuy$40 → $36
17 July 2026B of A SecuritiesUpgradeBuy—
24 June 2026BarclaysMaintainsOverweight—
24 June 2026BarclaysMaintainsOverweight$47 → $48
23 June 2026BairdMaintainsOutperform$47 → $50
23 June 2026BairdMaintainsOutperform—
23 June 2026RBC CapitalReiteratesOutperform$46

Price targets and ratings are third-party analyst estimates, reported here as data. They are not Ticker Nerd forecasts, and they are frequently wrong.

Market Radar

This page is one stock. Monday covers all of them.

Computed off the Friday close and sent before the US open.

Market Radar reports the week’s largest rank changes across roughly 4,600 US stocks, the factor behind each one, and where the market went. FRVO appears on the weeks it earns a place.

Free, every Monday. Unsubscribe any time.

Performance

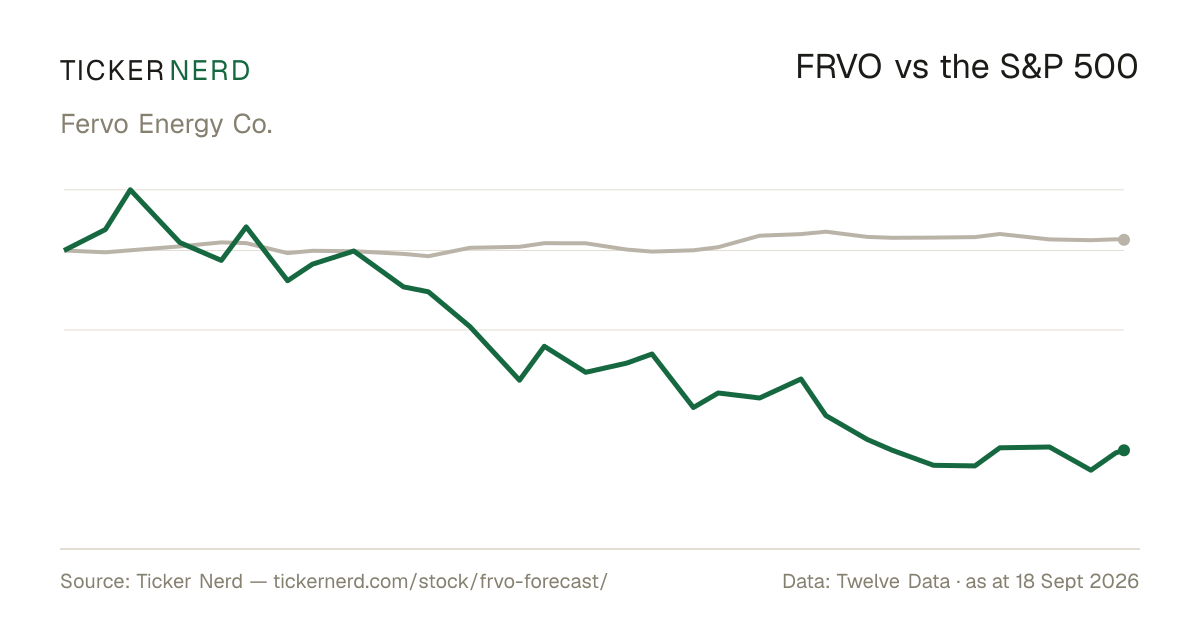
FRVO vs the S&P 500

Both lines are total return — dividends reinvested — so the comparison is honest on both sides.

FRVO vs S&P 500, last 12 monthsTotal return, rebased to 100
20406080100120Jun 26Jul 26Aug 26Sep 26Oct 26FRVOS&P 500

Download this chart as an image — free to reuse; link this page as the source.

Data provided by Twelve Data

Estimates

FRVO analyst estimate revisions

Not the forecast itself — the direction analysts are revising it. Revision direction is one of the model's factor families.

Which way the estimates are movingNext fiscal year
Analysts raising
1
Analysts cutting
2
Fundamentals

Fervo Energy Co. (FRVO) financial data

A margin means little on its own. Each bar marks where the figure sits across the whole US universe we score.

Valuation
Trailing P/E
−58.8×

Cheaper than 99% of US stocks

Price / sales
11318.1×

Cheaper than 1% of US stocks

Price / book
1.3×

Cheaper than 62% of US stocks

EV / EBITDA
−25.4×

Cheaper than 91% of US stocks

Growth & margins
Revenue growth (YoY)
85.2%

Higher than 91% of US stocks

Earnings growth (YoY)
—
Gross margin
−170.8%

Higher than 1% of US stocks

Operating margin
−25435.4%

Higher than 1% of US stocks

Net margin
−181.2%

Higher than 3% of US stocks

Returns & dividend
Return on equity
86.8%

Higher than 95% of US stocks

Return on assets
−4.2%

Higher than 33% of US stocks

Dividend yield
0.0%

Higher than 1% of US dividend payers

Bars mark the percentile across the ~4,600 US stocks Ticker Nerd covers, among those reporting the figure.

Key statistics

Fervo Energy Co. (FRVO) statistics: revenue, profit & scale

The headline figures, each with its date. Every row carries its own link — cite it straight from here.

  • Fervo Energy Co. has a market value of $3.5B and an enterprise value of $2.0B.

  • Revenue in the twelve months to 30 June 2026: $174K. The latest quarter grew 85.2% year on year.

  • Net income over the same four quarters: −$108.3M, a −62258.0% net margin.

  • Diluted earnings per share, trailing twelve months: $−0.58.

  • Free cash flow in the twelve months to 30 June 2026: −$650.2M, after $612.6M of capital spending.

  • Fervo Energy Co. spent $2.0M on share buybacks in the twelve months to 30 June 2026.

  • Shares outstanding: 294.7M.

  • Trailing P/E: −58.8×; forward P/E: −43.0× — the forward figure prices analyst consensus estimates, not reported earnings.

  • Forward dividend yield: 0.00%, paying out 0% of earnings.

  • Fervo Energy Co. employs 261 people — $666.7 of revenue per employee.

Statement figures: company filings via Twelve Data, four quarters to 30 June 2026 · market figures as at 14 Oct 2026

Data provided by Twelve Data

Peers

FRVO vs competitors

The nearest names by industry and size, scored by the same model — like for like.

Its peer group, ranked by the same modelUtilities - Renewable
CompanyMarket capTKN rank
FRVOFervo Energy Co.$3.5B
0
RNWReNew Energy Global Plc$2.5B
45
BEPCBrookfield Renewable Corp.$5.1B
7
MWHSOLV Energy, Inc.$5.1B
3
ORAOrmat Technologies, Inc.$5.4B
32
CWENClearway Energy, Inc.$6.1B
34
FLNCFluence Energy, Inc.$1.1B
19

Look up any of the roughly 4,600 stocks we score.

The rank is the raw material. Whether the rules would actually own Fervo Energy Co. — and when they’d sell — is the membership. See the Ticker Nerd 20 →

News

Latest FRVO news & analysis

Fervo Energy Company (FRVO) Scrutinized in New Report Questioning Geothermal Narrative, Stock Closes 46% Below IPO

PRNewsWire · 13 Oct 2026negative

Morpheus Research published an October 6 report alleging Fervo failed to disclose issues involving thermal decline, water loss, and seismicity-related equipment damage. Fervo shares fell intraday before closing at $14.33, about 46% below the $27 IPO price, according to the excerpt.

Why it matters — The report and the stock movement draw attention to operational concerns and recent infrastructure uncertainty around Fervo’s Cape Station project.

Fervo Energy Company (FRVO) Scrutinized in New Report Questioning Geothermal Narrative, Stock Closes 46% Below IPO - HBSS

PRNewsWire · 8 Oct 2026negative

Morpheus Research’s October 6 report alleged that Fervo had not disclosed thermal decline, excessive water loss, and seismicity-related equipment damage. Fervo shares fell intraday and recovered to close at $14.33, about 46% below its $27 IPO price.

Why it matters — The report raises questions about operational risks at Fervo and coincided with a decline in its share price.

Fervo Energy Launches Ground Truth, a Six-Part Podcast on the Creation of America's Leading Next-Generation Geothermal Company

GlobeNewsWire · 8 Oct 2026neutral

Fervo Energy launched “Ground Truth,” a six-part podcast about the creation of the company. The first episode is available now, with the series tracing its story from a Stanford class project to a $2.2 billion Nasdaq IPO.

Why it matters — The podcast offers FRVO watchers a company-produced account of Fervo’s origins and development.

Fervo Energy Company (FRVO) Shareholders Who Lost Money – Contact Law Offices of Howard G. Smith About Securities Fraud Investigation

Business Wire · 8 Oct 2026negative

The Law Offices of Howard G. Smith announced an investigation into possible federal securities-law violations by Fervo Energy Company. The firm invites investors who suffered losses to contact it about potentially pursuing claims.

Why it matters — The investigation concerns Fervo and may be relevant to shareholders monitoring legal issues related to the company.

Securities Fraud Investigation Into Fervo Energy Company (FRVO) Announced – Shareholders Who Lost Money Urged To Contact The Law Offices of Frank R. Cruz

Business Wire · 7 Oct 2026negative

The Law Offices of Frank R. Cruz announced an investigation into Fervo Energy on behalf of investors, concerning possible violations of federal securities laws. The announcement references an October 6, 2026 short report by Morpheus Research.

Why it matters — FRVO shareholders may follow the investigation and its claims regarding the company.

FAQ

Frequently asked questions about FRVO stock

What is the FRVO stock price forecast for 2026-2027?

The 14 Wall Street analysts covering Fervo Energy Co. have a median 12-month price target of $37, with estimates ranging from $25 to $51. These are third-party analyst estimates, not Ticker Nerd forecasts, and they are frequently wrong.

Is FRVO stock a buy right now?

Of the 14 analysts covering Fervo Energy Co., 14 rate it a Buy, 0 a Hold and 0 a Sell. Ticker Nerd's systematic factor model ranks Fervo Energy Co. 0 out of 100 across roughly 4,600 US stocks as at 14 Oct 2026. None of this is personal advice — it does not consider your circumstances.

How does Ticker Nerd's model rank FRVO?

As at 14 Oct 2026, Fervo Energy Co. ranks 0 out of 100 on Ticker Nerd's systematic factor model — a percentile across roughly 4,600 US stocks, built from its factor families. Its strongest factor family is Revisions (36 of 100).

Will FRVO stock go up?

No one can know that. What the data says: the median 12-month target from 14 analysts implies +238.2% from the last close, and Ticker Nerd's factor model ranks Fervo Energy Co. 0 out of 100 as at 14 Oct 2026. Analyst targets are third-party estimates and frequently wrong; none of this is personal advice.

What is the FRVO stock forecast for 2030?

No analyst covering Fervo Energy Co. publishes a 2030 price target — Wall Street targets run 12 to 18 months out. Sites quoting a 2030 price for FRVO are extrapolating price history, which says nothing about the business. The furthest attributed numbers are the current analyst targets: $25 to $51 over the next 12 months.

What does Fervo Energy Co. do?

Fervo Energy Company Class A Common Stock represents ownership in Fervo Energy Company, a geothermal energy developer and operator focused on producing electricity from underground heat resources. Fervo Energy builds, owns, and operates geothermal power facilities in the United States, using technology-enabled methods to access and develop enhanced geothermal systems.

What is the latest news on FRVO?

The most recent item we track (PRNewsWire, 13 Oct 2026): "Fervo Energy Company (FRVO) Scrutinized in New Report Questioning Geothermal Narrative, Stock Closes 46% Below IPO". Morpheus Research published an October 6 report alleging Fervo failed to disclose issues involving thermal decline, water loss, and seismicity-related equipment damage. Fervo shares fell intraday before closing at $14.33, about 46% below the $27 IPO price, according to the excerpt.

Company

About Fervo Energy Co.

Fervo Energy Company Class A Common Stock represents ownership in Fervo Energy Company, a geothermal energy developer and operator focused on producing electricity from underground heat resources. Fervo Energy builds, owns, and operates geothermal power facilities in the United States, using technology-enabled methods to access and develop enhanced geothermal systems. Its business centers on generating dependable, carbon-free power for utilities, large energy users, and the broader renewable electricity market. The company’s activities place it within the utilities and renewable energy sectors, where geothermal generation serves as a steady source of baseload power alongside other clean-energy technologies. Fervo Energy Company is headquartered in Houston, Texas, and its Class A common stock is used by public market investors to track the company’s operating progress and participation in the expanding geothermal power industry.

CEO Mr. Timothy Michael Latimer · 261 employees · United States · https://fervoenergy.com