EYPTEYPTHealthcare · Biotechnology

EYPT Stock Forecast: EyePoint, Inc. Price Predictions for 2026-2027

Last close, 8 Oct 2026
$3.46
+4.22% on the day

The 13 Wall Street analysts covering EyePoint, Inc. hold a median 12-month price target of $20 — +478.0% from the last close. Ticker Nerd's systematic factor model, run across ~4,600 US stocks, ranks it 11 of 100 as at 8 Oct 2026 — in the weakest quartile. The Street sees upside; the factor read is a caution. That gap is the story on this page.

Market cap
$290.1M
Ticker Nerd rank
11 / 100
Median analyst target
$20
Analysts covering
13
Revenue$507K−90.5% y/y
Operating income−$97.4M
Net income−$94.5M
Free cash flow−$63.5M
Quarterly, 8 quarters to 30 June 2026 · latest quarter's figure shown
Total return, dividends reinvested
1W
+7.1%
1M
−24.1%
YTD
−81.1%
1Y
−75.1%
From 52W high
−81.6%
From 52W low
+9.8%
$3
$19
52-week range, adjusted closes · the dot is the last close
Ticker Nerd rank

EYPT stock analysis: one number for the whole business

Consensus tells you what everyone already believes. The model scores EyePoint, Inc. on its factor families — the same systematic rank behind the Ticker Nerd portfolio.

Where the model ranks itAs at 8 Oct 2026
11 / 100

Percentile across ~4,600 US stocks on Ticker Nerd’s systematic factor model. Higher is better. How the model is built and tested

Accruals
78
Size
62
Revisions
30
Issuance
25
Value
22
Quality
21
Growth
18
Volatility
18
Momentum
8

Accruals (78): Reported profit is backed by cash, and the company is not expanding recklessly.

Momentum (8): The shares have been drifting down relative to others.

Built and run by Aslam Ghouse, an ex-Goldman Sachs quant trader with fourteen years in markets.

Wall Street

EYPT stock forecast 2026-2027: analyst price targets & predictions

The bullish and bearish analyst opinions on EYPT, reported as data — targets and ratings, the market's view beside the model's.

Share price and the analyst range, 12 monthsAdjusted close, US dollars
$0$20$40$60$80Jan 26Apr 26Jul 26Oct 26EYPTHigh $68Median $20Low $4

Price targets and ratings are third-party analyst estimates, reported here as data. They are not Ticker Nerd forecasts, and they are frequently wrong.

Data provided by Twelve Data

What Wall Street says13 analysts
7 Buy6 Hold0 Sell
Low $4Median $20High $68

The green dot is the last close — the median target sits +478.0% from it.

Recent analyst actionsNewest first

Of the 20 most recent actions, 1 moved their price target up and 6 moved it down.

DateFirmActionRatingTarget
2 Sept 2026TD CowenDowngradeHold$20 → $4.00
18 Aug 2026Chardan CapitalDowngradeNeutral—
18 Aug 2026Chardan CapitalDowngradeNeutral$65 → $5.00
18 Aug 2026CitigroupMaintainsBuy$35 → $17
18 Aug 2026CitigroupMaintainsBuy—
18 Aug 2026HC Wainwright & Co.DowngradeNeutral—
18 Aug 2026RBC CapitalDowngradeSector Perform$37 → $5.00
18 Aug 2026RBC CapitalDowngradeSector Perform—
17 Aug 2026Chardan CapitalMaintainsBuy—
17 Aug 2026Chardan CapitalMaintainsBuy$65
17 Aug 2026JefferiesMaintainsBuy—
17 Aug 2026JefferiesMaintainsBuy$30 → $8.00
17 Aug 2026JP MorganDowngradeNeutral—
7 Aug 2026Chardan CapitalMaintainsBuy—
7 Aug 2026Chardan CapitalMaintainsBuy$65
6 Aug 2026Cantor FitzgeraldMaintainsOverweight—
6 Aug 2026Cantor FitzgeraldMaintainsOverweight$47 → $55
6 Aug 2026HC Wainwright & Co.MaintainsBuy$30 → $27

Price targets and ratings are third-party analyst estimates, reported here as data. They are not Ticker Nerd forecasts, and they are frequently wrong.

Market Radar

This page is one stock. Monday covers all of them.

Computed off the Friday close and sent before the US open.

Market Radar reports the week’s largest rank changes across roughly 4,600 US stocks, the factor behind each one, and where the market went. EYPT appears on the weeks it earns a place.

Free, every Monday. Unsubscribe any time.

Performance

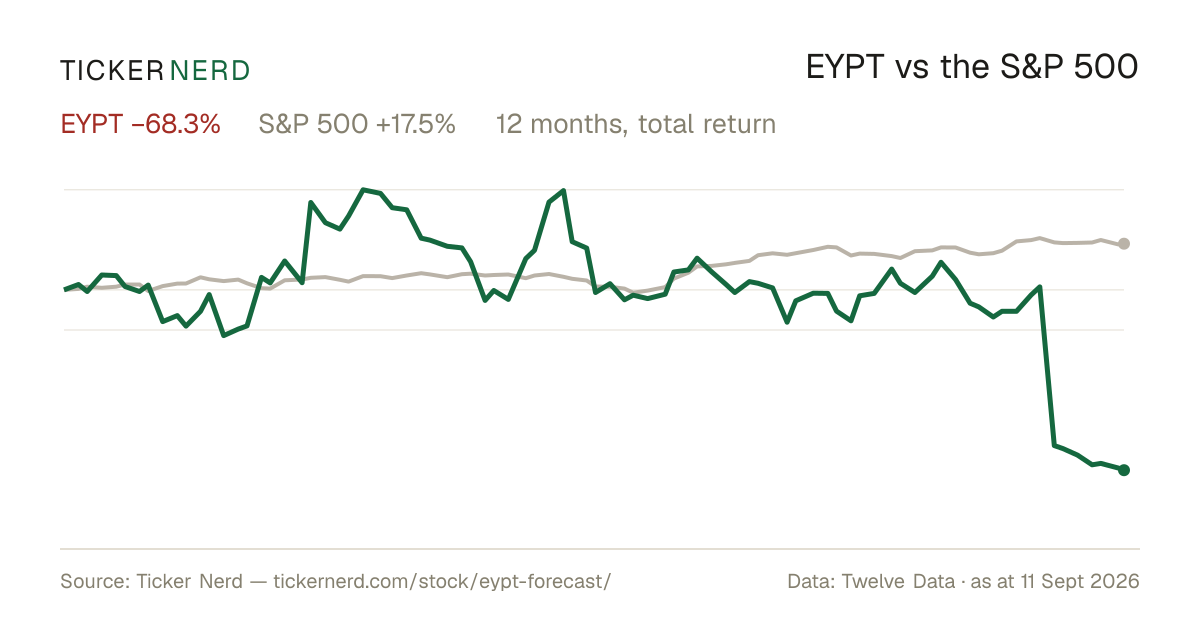
EYPT vs the S&P 500

Both lines are total return — dividends reinvested — so the comparison is honest on both sides.

Over the twelve months to 8 Oct 2026, EyePoint, Inc. returned −75.1% against +16.2% for the S&P 500, dividends included.

EYPT vs S&P 500, last 12 monthsTotal return, rebased to 100
20406080100120140Jan 26Apr 26Jul 26Oct 26EYPTS&P 500

Download this chart as an image — free to reuse; link this page as the source.

Data provided by Twelve Data

Estimates

EYPT analyst estimate revisions

Not the forecast itself — the direction analysts are revising it. Revision direction is one of the model's factor families.

Which way the estimates are movingNext fiscal year
Analysts raising
2
Analysts cutting
9
Fundamentals

EyePoint, Inc. (EYPT) financial data

A margin means little on its own. Each bar marks where the figure sits across the whole US universe we score.

Valuation
Trailing P/E
−1.1×

Cheaper than 83% of US stocks

Price / sales
104.0×

Cheaper than 4% of US stocks

Price / book
1.8×

Cheaper than 48% of US stocks

EV / EBITDA
−0.4×

Cheaper than 65% of US stocks

Growth & margins
Revenue growth (YoY)
−90.5%

Higher than 2% of US stocks

Earnings growth (YoY)
−90.5%

Higher than 3% of US stocks

Gross margin
100.0%

Higher than 99% of US stocks

Operating margin
−19207.1%

Higher than 1% of US stocks

Net margin
93.4%

Higher than 99% of US stocks

Returns & dividend
Return on equity
−148.7%

Higher than 10% of US stocks

Return on assets
−74.9%

Higher than 4% of US stocks

Dividend yield
0.0%

Higher than 1% of US dividend payers

Bars mark the percentile across the ~4,600 US stocks Ticker Nerd covers, among those reporting the figure.

Key statistics

EyePoint, Inc. (EYPT) statistics: revenue, profit & scale

The headline figures, each with its date. Every row carries its own link — cite it straight from here.

  • EyePoint, Inc. has a market value of $290.1M and an enterprise value of $140.2M.

  • Revenue in the twelve months to 30 June 2026: $2.8M. The latest quarter shrank 90.5% year on year.

  • Net income over the same four quarters: −$306.6M, a −10994.7% net margin.

  • Diluted earnings per share, trailing twelve months: $−3.74.

  • Free cash flow in the twelve months to 30 June 2026: −$271.3M.

  • Shares outstanding: 85.0M.

  • Trailing P/E: −1.1×; forward P/E: −1.2× — the forward figure prices analyst consensus estimates, not reported earnings.

  • Forward dividend yield: 0.00%, paying out 0% of earnings.

  • EyePoint, Inc. employs 214 people — $13K of revenue per employee.

Statement figures: company filings via Twelve Data, four quarters to 30 June 2026 · market figures as at 9 Oct 2026

Data provided by Twelve Data

Peers

EYPT vs competitors

The nearest names by industry and size, scored by the same model — like for like.

Its peer group, ranked by the same modelBiotechnology
CompanyMarket capTKN rank
EYPTEyePoint, Inc.$290.1M
11
FULCFulcrum Therapeutics, Inc.$286.1M
38
LRMRLarimar Therapeutics, Inc.$285.1M
29
RCKTRocket Pharmaceuticals, Inc.$284.6M
58
ABEOAbeona Therapeutics, Inc.$283.0M
40
BNTCBenitec Biopharma, Inc.$294.5M
39
XFORX4 Pharmaceuticals, Inc.$276.6M
58

Look up any of the roughly 4,600 stocks we score.

The rank is the raw material. Whether the rules would actually own EyePoint, Inc. — and when they’d sell — is the membership. See the Ticker Nerd 20 →

News

Latest EYPT news & analysis

These beaten-down stocks could bounce back in January, if history is any guide

Market Watch · 21 Sept 2026positive

Market Watch reports that tax-loss selling is expected to artificially depress 20 stocks, including EyePoint, Inc., during the fourth quarter. The article suggests these stocks may recover in the new year if historical patterns hold.

Why it matters — EYPT watchers would want to know that the stock's recent weakness may be tied to tax-loss selling rather than company-specific fundamentals, with a possible rebound expected in January.

EyePoint Reports Inducement Grants Under NASDAQ Listing Rule 5635(c)(4)

GlobeNewsWire · 16 Sept 2026neutral

EyePoint, Inc. announced it granted non-statutory stock options to a new employee as an inducement award outside its 2023 Long-Term Incentive Plan, in accordance with NASDAQ Listing Rule 5635(c)(4). The grant was reported in a September 16, 2026 press release.

Why it matters — The grant reflects standard staffing and incentive activity for a newly hired employee, giving EYPT watchers routine operational information rather than any change to its business outlook.

EyePoint, Inc. (EYPT) Presents at Morgan Stanley 24th Annual Global Healthcare Conference Transcript

Seeking Alpha · 15 Sept 2026neutral

EyePoint, Inc. (EYPT) presented at the Morgan Stanley 24th Annual Global Healthcare Conference, with a transcript of the event published on Seeking Alpha. The presentation provided an opportunity for the company's leadership to discuss its business with conference attendees.

Why it matters — The presentation gives EyePoint investors visibility into the company's current positioning and messaging during a major industry conference.

EYPT Investigation Alert: EyePoint, Inc. Investors Encouraged to Contact Kessler Topaz Meltzer & Check, LLP

GlobeNewsWire · 10 Sept 2026negative

Kessler Topaz Meltzer & Check, LLP announced it is investigating potential violations of federal securities laws by EyePoint, Inc. The law firm is reaching out to investors who purchased EyePoint securities and experienced significant financial losses.

Why it matters — A securities litigation investigation signals potential legal and regulatory concerns for EyePoint that could carry financial and reputational implications for the company and its shareholders.

EyePoint, Inc. (EYPT) Presents at Citigroup's Biopharma Back to School Summit 2026 Transcript

Seeking Alpha · 9 Sept 2026neutral

EyePoint, Inc. presented at Citigroup's Biopharma Back to School Summit 2026, with a transcript of the presentation published on Seeking Alpha. The presentation covered the company's remarks at the conference.

Why it matters — A Eyepoint watcher would care because it offers insight into how the company communicates its strategy and updates to investors at a notable industry conference.

FAQ

Frequently asked questions about EYPT stock

What is the EYPT stock price forecast for 2026-2027?

The 13 Wall Street analysts covering EyePoint, Inc. have a median 12-month price target of $20, with estimates ranging from $4 to $68. These are third-party analyst estimates, not Ticker Nerd forecasts, and they are frequently wrong.

Is EYPT stock a buy right now?

Of the 13 analysts covering EyePoint, Inc., 7 rate it a Buy, 6 a Hold and 0 a Sell. Ticker Nerd's systematic factor model ranks EyePoint, Inc. 11 out of 100 across roughly 4,600 US stocks as at 8 Oct 2026. None of this is personal advice — it does not consider your circumstances.

How does Ticker Nerd's model rank EYPT?

As at 8 Oct 2026, EyePoint, Inc. ranks 11 out of 100 on Ticker Nerd's systematic factor model — a percentile across roughly 4,600 US stocks, built from its factor families. Its strongest factor family is Accruals (78 of 100).

Will EYPT stock go up?

No one can know that. What the data says: the median 12-month target from 13 analysts implies +478.0% from the last close, and Ticker Nerd's factor model ranks EyePoint, Inc. 11 out of 100 as at 8 Oct 2026. Analyst targets are third-party estimates and frequently wrong; none of this is personal advice.

What is the EYPT stock forecast for 2030?

No analyst covering EyePoint, Inc. publishes a 2030 price target — Wall Street targets run 12 to 18 months out. Sites quoting a 2030 price for EYPT are extrapolating price history, which says nothing about the business. The furthest attributed numbers are the current analyst targets: $4 to $68 over the next 12 months.

How has EYPT stock performed over the past year?

EyePoint, Inc. returned -75.1% over the 12 months to 8 Oct 2026, with dividends reinvested. Past performance does not indicate future returns.

What does EyePoint, Inc. do?

EyePoint, Inc. Common Stock represents equity in EyePoint, Inc., a biopharmaceutical company focused on developing and commercializing therapies for serious retinal diseases.

What is the latest news on EYPT?

The most recent item we track (Market Watch, 21 Sept 2026): "These beaten-down stocks could bounce back in January, if history is any guide". Market Watch reports that tax-loss selling is expected to artificially depress 20 stocks, including EyePoint, Inc., during the fourth quarter. The article suggests these stocks may recover in the new year if historical patterns hold.

Company

About EyePoint, Inc.

EyePoint, Inc. Common Stock represents equity in EyePoint, Inc., a biopharmaceutical company focused on developing and commercializing therapies for serious retinal diseases. The company’s current portfolio centers on ophthalmology products and sustained-release drug delivery technologies designed to treat eye disorders and improve the management of retinal conditions. Its marketed and development-stage programs address areas such as retinal vascular disease, diabetic macular edema, and other eye diseases, using proprietary platforms that support localized, long-acting treatment delivery. EyePoint, Inc. serves the specialized eye-care market, working with healthcare providers and the broader ophthalmic industry through products and pipeline assets that target chronic retinal conditions. Headquartered in Watertown, Massachusetts, the company is positioned within the life sciences sector as a developer of therapies and drug-delivery systems for ophthalmic use.

CEO Dr. Jay S. Duker M.D. · 214 employees · United States · https://eyepoint.bio