 GOROBasic Materials · Gold
GORO Stock Forecast: Gold Resource Corp. Price Predictions for 2026-2027
The 1 Wall Street analysts covering Gold Resource Corp. hold a median 12-month price target of $1.75 — -19.0% from the last close.
GORO stock analysis: one number for the whole business
Consensus tells you what everyone already believes. The model scores Gold Resource Corp. on its factor families — the same systematic rank behind the Ticker Nerd portfolio.
We don’t hold a current model rank for this company.
Built and run by Aslam Ghouse, an ex-Goldman Sachs quant trader with fourteen years in markets.
GORO stock forecast 2026-2027: analyst price targets & predictions
The bullish and bearish analyst opinions on GORO, reported as data — targets and ratings, the market's view beside the model's.
Price targets and ratings are third-party analyst estimates, reported here as data. They are not Ticker Nerd forecasts, and they are frequently wrong.
Data provided by Twelve Data
The green dot is the last close — the median target sits −19.0% from it.
| Date | Firm | Action | Rating | Target |
|---|---|---|---|---|
| 19 Mar 2026 | HC Wainwright & Co. | Maintains | Buy | — |
| 27 Jan 2026 | HC Wainwright & Co. | Reiterates | Buy | — |
| 21 Jan 2026 | HC Wainwright & Co. | Maintains | Buy | — |
| 6 Aug 2025 | HC Wainwright & Co. | Maintains | Buy | — |
| 1 Aug 2025 | HC Wainwright & Co. | Maintains | Buy | — |
| 7 Mar 2025 | HC Wainwright & Co. | Maintains | Buy | — |
| 8 Aug 2024 | HC Wainwright & Co. | Maintains | Buy | — |
| 15 Mar 2024 | HC Wainwright & Co. | Maintains | Buy | — |
| 8 Nov 2023 | HC Wainwright & Co. | Maintains | Buy | — |
| 7 Nov 2023 | HC Wainwright & Co. | Maintains | Buy | — |
| 28 July 2023 | HC Wainwright & Co. | Reiterates | Buy | — |
| 17 July 2023 | HC Wainwright & Co. | Maintains | Buy | — |
| 27 Apr 2023 | HC Wainwright & Co. | Reiterates | Buy | — |
| 14 Apr 2023 | HC Wainwright & Co. | Reiterates | Buy | — |
| 6 Mar 2023 | HC Wainwright & Co. | Reiterates | Buy | — |
| 14 Feb 2023 | HC Wainwright & Co. | Maintains | Buy | — |
| 13 Oct 2022 | HC Wainwright & Co. | Maintains | Buy | — |
| 29 July 2022 | HC Wainwright & Co. | Maintains | Buy | — |
| 14 Mar 2022 | HC Wainwright & Co. | Maintains | Buy | — |
| 30 Apr 2021 | HC Wainwright & Co. | Maintains | Buy | — |
Price targets and ratings are third-party analyst estimates, reported here as data. They are not Ticker Nerd forecasts, and they are frequently wrong.
This page is one stock. Monday covers all of them.
GORO appears in the Radar on the weeks it earns a place.
- Market Radar, every Monday: the week's biggest rank moves across ~4,600 US stocks, and the reason for each.
- The AI build-out map, free: every AI company we track, part by part, and one part in full with each verdict.
- The AI build-out, every Wednesday: how AI stocks did, part by part.
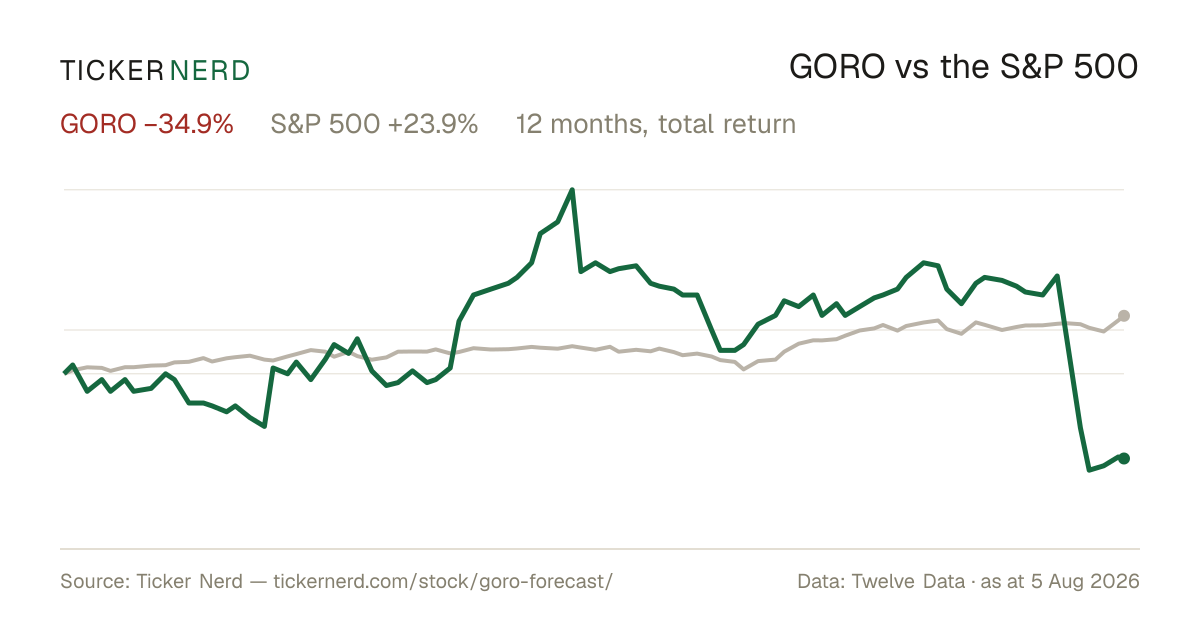
GORO vs the S&P 500
Both lines are total return — dividends reinvested — so the comparison is honest on both sides.
Over the twelve months to 5 Aug 2026, Gold Resource Corp. returned −34.9% against +23.9% for the S&P 500, dividends included.
Download this chart as an image — free to reuse; link this page as the source.
Data provided by Twelve Data
GORO analyst estimate revisions
Not the forecast itself — the direction analysts are revising it. Revision direction is one of the model's factor families.
Gold Resource Corp. (GORO) financial data
A margin means little on its own. Each bar marks where the figure sits across the whole US universe we score.
- Trailing P/E
- 19.9×
- Price / sales
- 10.2×
- Price / book
- −44.4×
- EV / EBITDA
- 87.3×
Cheaper than 38% of US stocks
Cheaper than 13% of US stocks
Cheaper than 99% of US stocks
Cheaper than 3% of US stocks
- Revenue growth (YoY)
- 293.5%
- Earnings growth (YoY)
- 293.5%
- Gross margin
- 29.5%
- Operating margin
- 20.3%
- Net margin
- −46.6%
Higher than 97% of US stocks
Higher than 92% of US stocks
Higher than 33% of US stocks
Higher than 79% of US stocks
Higher than 11% of US stocks
- Return on equity
- 450.9%
- Return on assets
- 0.3%
- Dividend yield
- 1.2%
Higher than 99% of US stocks
Higher than 45% of US stocks
Higher than 72% of US dividend payers
Bars mark the percentile across the ~4,600 US stocks Ticker Nerd covers, among those reporting the figure.
Gold Resource Corp. (GORO) statistics: revenue, profit & scale
The headline figures, each with its date. Every row carries its own link — cite it straight from here.
Gold Resource Corp. has a market value of $566.2M and an enterprise value of $438.8M.
Revenue in the twelve months to 30 June 2026: $55.3M. The latest quarter grew 293.5% year on year.
Net income over the same four quarters: −$25.8M, a −46.6% net margin.
Free cash flow in the twelve months to 30 June 2026: $13.7M.
Trailing P/E: 19.9×; forward P/E: 83.8× — the forward figure prices analyst consensus estimates, not reported earnings.
Forward dividend yield: 1.19%, paying out 0% of earnings.
Gold Resource Corp. employs 480 people — $115K of revenue per employee.
Data provided by Twelve Data
GORO vs competitors
The nearest names by industry and size, scored by the same model — like for like.
| Company | Market cap | TKN rank |
|---|---|---|
| GOROGold Resource Corp. | $566.2M | — |
| LINLinde Plc* | $238.3B | 71 |
| SCCOSouthern Copper Corp.* | $155.0B | 92 |
| NEMNewmont Corp. | $124.5B | 90 |
| AEMAgnico Eagle Mines Ltd. | $94.7B | — |
| FCXFreeport-McMoRan, Inc.* | $92.9B | 84 |
| SHWThe Sherwin-Williams Co.* | $85.2B | 69 |
* Nearest Basic Materials names by size — few gold companies of this scale trade in the US universe.
Look up any of the roughly 4,600 stocks we score.
The rank is the raw material. Whether the rules would actually own Gold Resource Corp. — and when they’d sell — is the membership. See the Ticker Nerd 20 →
Frequently asked questions about GORO stock
What is the GORO stock price forecast for 2026-2027?
The 1 Wall Street analysts covering Gold Resource Corp. have a median 12-month price target of $1.75, with estimates ranging from $1.75 to $1.75. These are third-party analyst estimates, not Ticker Nerd forecasts, and they are frequently wrong.
Is GORO stock a buy right now?
Of the 1 analysts covering Gold Resource Corp., 1 rate it a Buy, 0 a Hold and 0 a Sell. None of this is personal advice — it does not consider your circumstances.
Will GORO stock go up?
No one can know that. What the data says: the median 12-month target from 1 analysts implies -19.0% from the last close. Analyst targets are third-party estimates and frequently wrong; none of this is personal advice.
What is the GORO stock forecast for 2030?
No analyst covering Gold Resource Corp. publishes a 2030 price target — Wall Street targets run 12 to 18 months out. Sites quoting a 2030 price for GORO are extrapolating price history, which says nothing about the business. The furthest attributed numbers are the current analyst targets: $1.75 to $1.75 over the next 12 months.
How has GORO stock performed over the past year?
Gold Resource Corp. returned -34.9% over the 12 months to 5 Aug 2026, with dividends reinvested. Past performance does not indicate future returns.
What does Gold Resource Corp. do?
Gold Resource Corporation is a mining company specializing in the exploration, development, and production of precious metals, predominantly gold and silver. The company's primary function is to extract and process these metals, transforming them into valuable commodities for various industrial applications and investment purposes.
About Gold Resource Corp.
Gold Resource Corporation is a mining company specializing in the exploration, development, and production of precious metals, predominantly gold and silver. The company's primary function is to extract and process these metals, transforming them into valuable commodities for various industrial applications and investment purposes. Operating across North America, Gold Resource Corporation primarily focuses on its properties in Mexico and Nevada, USA. Notable for its low-cost production and strategic allocation of resources, the company impacts sectors such as technology, where gold is used in electronics, and financial markets, where gold serves as a hedge against inflation and a storage of value. Gold Resource Corporation plays a crucial role in the commodity market, supplying raw materials that are essential for both industrial uses and jewelry fabrication. Its operations contribute to the broader metal and mining sector, significantly influencing global supply chains and market dynamics. As a publicly traded company, it provides insights into market trends and economic conditions through its operational performance and stock price fluctuations.
CEO Mr. Francisco Javier Reyes de la Campa · 480 employees · Canada · https://goldgroupmining.com