SHWSHWBasic Materials · Specialty Chemicals

SHW Stock Forecast: The Sherwin-Williams Co. Price Predictions for 2026-2027

Last close, 27 Aug 2026
$345
−0.99% on the day

The 26 Wall Street analysts covering The Sherwin-Williams Co. hold a median 12-month price target of $396 — +14.6% from the last close. Ticker Nerd's systematic factor model, run across ~4,600 US stocks, ranks it 73 of 100 as at 26 Aug 2026 — in the upper half. Here, the model and the Street point the same way.

Market cap
$84.6B
Ticker Nerd rank
73 / 100
Median analyst target
$396
Analysts covering
26
Revenue$6.8B+7.5% y/y
Operating income$1.2B
Net income$843.6M
Free cash flow$1.2B
Quarterly, 8 quarters to 30 June 2026 · latest quarter's figure shown
Total return, dividends reinvested
1W
−0.3%
1M
+5.7%
YTD
+7.3%
1Y
−5.2%
From 52W high
−7.1%
From 52W low
+18.1%
$292
$372
52-week range, adjusted closes · the dot is the last close
Ticker Nerd rank

SHW stock analysis: one number for the whole business

Consensus tells you what everyone already believes. The model scores The Sherwin-Williams Co. on its factor families — the same systematic rank behind the Ticker Nerd portfolio.

Where the model ranks itAs at 26 Aug 2026
73 / 100

Percentile across ~4,600 US stocks on Ticker Nerd’s systematic factor model. Higher is better. How the model is built and tested

Quality
94
Revisions
94
Volatility
88
Momentum
60
Value
55
Issuance
54
Accruals
49
Growth
48
Size
3

Quality (94): The business earns solid, repeatable profits on what it owns.

Growth (48): Sales and profits are flat, shrinking, or growing more slowly than they were.

Size (3): Larger than most of the companies we track — more scrutinised, less often mispriced.

Built and run by Aslam Ghouse, an ex-Goldman Sachs quant trader with fourteen years in markets.

Wall Street

SHW stock forecast 2026-2027: analyst price targets & predictions

The bullish and bearish analyst opinions on SHW, reported as data — targets and ratings, the market's view beside the model's.

Share price and the analyst range, 12 monthsAdjusted close, US dollars
$300$350$400Oct 25Jan 26Apr 26Jul 26SHWHigh $420Median $396Low $340

Price targets and ratings are third-party analyst estimates, reported here as data. They are not Ticker Nerd forecasts, and they are frequently wrong.

Data provided by Twelve Data

What Wall Street says26 analysts
15 Buy11 Hold0 Sell
Low $340Median $396High $420

The green dot is the last close — the median target sits +14.6% from it.

Recent analyst actionsNewest first

Of the 20 most recent actions, 6 moved their price target up and 0 moved it down.

DateFirmActionRatingTarget
25 Aug 2026DA DavidsonInitiatesBuy$400
3 Aug 2026GuggenheimInitiatesBuy$400
29 July 2026BMO CapitalMaintainsOutperform$400$405
29 July 2026JP MorganMaintainsOverweight$365$380
29 July 2026Morgan StanleyMaintainsOverweight$385$395
29 July 2026Wells FargoMaintainsEqual-Weight$350$360
8 July 2026RBC CapitalMaintainsOutperform$391$405
8 July 2026RBC CapitalMaintainsOutperform
6 July 2026BMO CapitalMaintainsOutperform$355$400
6 July 2026BMO CapitalMaintainsOutperform
24 June 2026CitigroupMaintainsBuy
4 June 2026BMO CapitalMaintainsOutperform
4 June 2026CitigroupReinstatesBuy$355
2 June 2026UBSDowngradeNeutral
8 May 2026Evercore ISI GroupMaintainsOutperform
29 Apr 2026Evercore ISI GroupMaintainsOutperform
29 Apr 2026JP MorganMaintainsOverweight
29 Apr 2026Wells FargoMaintainsEqual-Weight
21 Apr 2026B of A SecuritiesMaintainsNeutral
10 Apr 2026Wells FargoDowngradeEqual-Weight

Price targets and ratings are third-party analyst estimates, reported here as data. They are not Ticker Nerd forecasts, and they are frequently wrong.

Market Radar

This page is one stock. Monday covers all of them.

Computed off the Friday close and sent before the US open.

Market Radar reports the week’s largest rank changes across roughly 4,600 US stocks, the factor behind each one, and where the market went. SHW appears on the weeks it earns a place.

Free, every Monday. Unsubscribe any time.

Performance

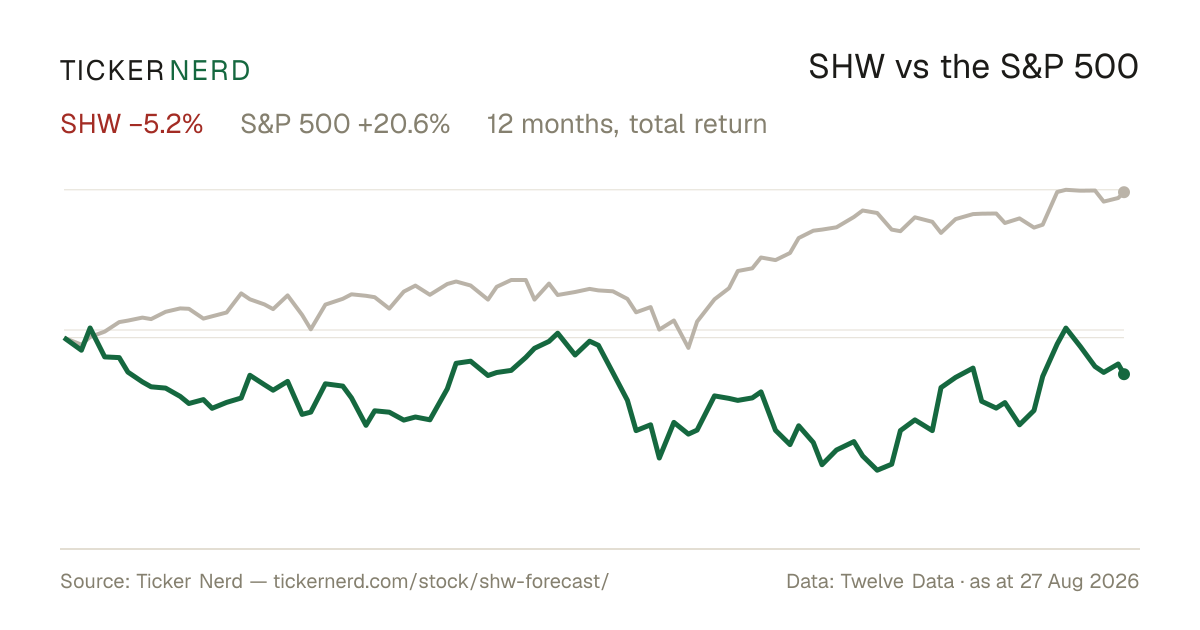
SHW vs the S&P 500

Both lines are total return — dividends reinvested — so the comparison is honest on both sides.

Over the twelve months to 27 Aug 2026, The Sherwin-Williams Co. returned −5.2% against +20.6% for the S&P 500, dividends included.

SHW vs S&P 500, last 12 monthsTotal return, rebased to 100
8090100110120Oct 25Jan 26Apr 26Jul 26SHWS&P 500

Download this chart as an image — free to reuse; link this page as the source.

Data provided by Twelve Data

Estimates

SHW analyst estimate revisions

Not the forecast itself — the direction analysts are revising it. Revision direction is one of the model's factor families.

Which way the estimates are movingNext fiscal year
EPS revision, 90 days
+3.0%
Analysts raising
21
Analysts cutting
0
Fundamentals

The Sherwin-Williams Co. (SHW) financial data

A margin means little on its own. Each bar marks where the figure sits across the whole US universe we score.

Valuation
Trailing P/E
31.9×

Cheaper than 25% of US stocks

Price / sales
3.4×

Cheaper than 37% of US stocks

Price / book
21.7×

Cheaper than 5% of US stocks

EV / EBITDA
21.0×

Cheaper than 15% of US stocks

Growth & margins
Revenue growth (YoY)
7.5%

Higher than 45% of US stocks

Earnings growth (YoY)
11.8%

Higher than 50% of US stocks

Gross margin
49.2%

Higher than 61% of US stocks

Operating margin
18.1%

Higher than 77% of US stocks

Net margin
11.0%

Higher than 72% of US stocks

Returns & dividend
Return on equity
65.1%

Higher than 94% of US stocks

Return on assets
9.5%

Higher than 91% of US stocks

Dividend yield
0.9%

Higher than 21% of US dividend payers

Bars mark the percentile across the ~4,600 US stocks Ticker Nerd covers, among those reporting the figure.

Key statistics

The Sherwin-Williams Co. (SHW) statistics: revenue, profit & scale

The headline figures, each with its date. Every row carries its own link — cite it straight from here.

  • The Sherwin-Williams Co. has a market value of $84.6B and an enterprise value of $98.9B.

  • Revenue in the twelve months to 30 June 2026: $24.4B. The latest quarter grew 7.5% year on year.

  • Net income over the same four quarters: $2.7B, a 11.0% net margin.

  • Diluted earnings per share, trailing twelve months: $10.85.

  • Free cash flow in the twelve months to 30 June 2026: $3.2B, after $673.5M of capital spending.

  • The Sherwin-Williams Co. spent $2.6B on share buybacks and $786.1M on dividends in the twelve months to 30 June 2026.

  • Shares outstanding: 242.8M.

  • Trailing P/E: 31.9×; forward P/E: 25.4× — the forward figure prices analyst consensus estimates, not reported earnings.

  • Forward dividend yield: 0.93%, paying out 29% of earnings.

  • The Sherwin-Williams Co. employs 64,249 people $380K of revenue per employee.

Statement figures: company filings via Twelve Data, four quarters to 30 June 2026 · market figures as at 27 Aug 2026

Data provided by Twelve Data

Peers

SHW vs competitors

The nearest names by industry and size, scored by the same model — like for like.

Its peer group, ranked by the same modelSpecialty Chemicals
CompanyMarket capTKN rank
SHWThe Sherwin-Williams Co.$84.6B
73
ECLEcolab, Inc.$82.3B
46
APDAir Products & Chemicals, Inc.$68.3B
77
LINLinde Plc$229.0B
64
PPGPPG Industries, Inc.$25.7B
87
IFFInternational Flavors & Fragrances, Inc.$22.3B
55
LYBLyondellBasell Industries NV$20.2B
64

Look up any of the roughly 4,600 stocks we score.

The rank is the raw material. Whether the rules would actually own The Sherwin-Williams Co. — and when they’d sell — is the membership. See the Ticker Nerd 20 →

News

Latest SHW news & analysis

Sherwin-Williams (SHW) Up 1.4% Since Last Earnings Report: Can It Continue?

Zacks Investment Research · 27 Aug 2026neutral

Sherwin-Williams reported earnings 30 days ago, and its stock has risen 1.4% since that report. The article examines what may come next for the company's shares.

Why it matters — A SHW watcher would care because the piece assesses the stock's performance following the latest earnings report and what might lie ahead.

Best Dividend Kings: August 2026

Seeking Alpha · 24 Aug 2026positive

An August 2026 report notes that Dividend Kings are outperforming the S&P 500 year-to-date, with a 14.98% total return versus SPY's 12.89%. Thirty Dividend Kings are beating SPY, while dividend growth among the group accelerated, with the average rate rising to 4.12% and several notable increases announced.

Why it matters — As a Dividend King, Sherwin-Williams sits within a group that is outperforming the broader market and showing accelerating dividend growth, which may be relevant to income-focused SHW watchers.

Insider Sheds $2.9 Million Worth of Stock Following Option Exercise

The Motley Fool · 15 Aug 2026neutral

On August 7, 2026, an insider (Jorgenrud) sold 7,886 shares at $368.30 per share for a total liquidation value of approximately $2.9 million, following an immediate option exercise. The sale reduced Jorgenrud's direct equity holdings by 40%, including the shares acquired through the option exercise.

Why it matters — A Sherwin-Williams watcher would monitor this insider sale because a 40% reduction in direct holdings following an option exercise can signal insider sentiment about the company's valuation.

Dividend Champion, Contender, And Challenger Highlights: Week August 16

Seeking Alpha · 14 Aug 2026neutral

The article provides a weekly summary of dividend activity for Dividend Champions, Contenders, and Challengers, listing companies that changed their dividends and those with upcoming ex-dividend dates.

Why it matters — Sherwin-Williams watchers would care because the company's dividend status or changes could be highlighted in these summaries, offering insight into its dividend health relative to peers.

After Golden Cross, Sherwin-Williams (SHW)'s Technical Outlook is Bright

Zacks Investment Research · 13 Aug 2026positive

Zacks Investment Research noted that Sherwin-Williams (SHW) experienced a "golden cross" technical event, where its 50-day simple moving average rose above its 200-day simple moving average.

Why it matters — A golden cross is often viewed by technical analysts as a bullish signal, indicating potential upward momentum for the stock.

FAQ

Frequently asked questions about SHW stock

What is the SHW stock price forecast for 2026-2027?

The 26 Wall Street analysts covering The Sherwin-Williams Co. have a median 12-month price target of $396, with estimates ranging from $340 to $420. These are third-party analyst estimates, not Ticker Nerd forecasts, and they are frequently wrong.

Is SHW stock a buy right now?

Of the 26 analysts covering The Sherwin-Williams Co., 15 rate it a Buy, 11 a Hold and 0 a Sell. Ticker Nerd's systematic factor model ranks The Sherwin-Williams Co. 73 out of 100 across roughly 4,600 US stocks as at 26 Aug 2026. None of this is personal advice — it does not consider your circumstances.

How does Ticker Nerd's model rank SHW?

As at 26 Aug 2026, The Sherwin-Williams Co. ranks 73 out of 100 on Ticker Nerd's systematic factor model — a percentile across roughly 4,600 US stocks, built from its factor families. Its strongest factor family is Quality (94 of 100).

Will SHW stock go up?

No one can know that. What the data says: the median 12-month target from 26 analysts implies +14.6% from the last close, and Ticker Nerd's factor model ranks The Sherwin-Williams Co. 73 out of 100 as at 26 Aug 2026. Analyst targets are third-party estimates and frequently wrong; none of this is personal advice.

What is the SHW stock forecast for 2030?

No analyst covering The Sherwin-Williams Co. publishes a 2030 price target — Wall Street targets run 12 to 18 months out. Sites quoting a 2030 price for SHW are extrapolating price history, which says nothing about the business. The furthest attributed numbers are the current analyst targets: $340 to $420 over the next 12 months.

How has SHW stock performed over the past year?

The Sherwin-Williams Co. returned -5.2% over the 12 months to 27 Aug 2026, with dividends reinvested. Past performance does not indicate future returns.

What does The Sherwin-Williams Co. do?

The Sherwin-Williams Company is a global paints and coatings manufacturer that serves professional contractors, industrial customers, commercial users, and retail consumers. The company develops, manufactures, distributes, and sells a wide range of products, including architectural paints, stains, varnishes, protective coatings, wood finishes, marine coatings, automotive refinish products, primers, sealants, aerosols, caulks, adhesives, and specialty treatments.

What is the latest news on SHW?

The most recent item we track (Zacks Investment Research, 27 Aug 2026): "Sherwin-Williams (SHW) Up 1.4% Since Last Earnings Report: Can It Continue?". Sherwin-Williams reported earnings 30 days ago, and its stock has risen 1.4% since that report. The article examines what may come next for the company's shares.

Company

About The Sherwin-Williams Co.

The Sherwin-Williams Company is a global paints and coatings manufacturer that serves professional contractors, industrial customers, commercial users, and retail consumers. The company develops, manufactures, distributes, and sells a wide range of products, including architectural paints, stains, varnishes, protective coatings, wood finishes, marine coatings, automotive refinish products, primers, sealants, aerosols, caulks, adhesives, and specialty treatments. Sherwin-Williams operates through three core business segments: Paint Stores Group, Consumer Brands Group, and Performance Coatings Group. Its Paint Stores Group supports architectural and industrial painting needs, while Consumer Brands Group supplies branded and private-label products through retailers and distributors. Performance Coatings Group focuses on industrial and specialty applications across multiple end markets. Headquartered in Cleveland, Ohio, Sherwin-Williams is a major supplier across the paints, coatings, and related chemicals market.

CEO Ms. Heidi G. Petz · 64,249 employees · United States · https://www.sherwin-williams.com