GSMGSMBasic Materials · Other Industrial Metals & Mining

GSM Stock Forecast: Ferroglobe PLC Price Predictions for 2026-2027

Last close, 21 Aug 2026
$4.08
+5.97% on the day

The 2 Wall Street analysts covering Ferroglobe PLC hold a median 12-month price target of $6 — +47.1% from the last close. Ticker Nerd's systematic factor model, run across ~4,600 US stocks, ranks it 48 of 100 as at 21 Aug 2026 — in the lower half.

Market cap
$777.3M
Ticker Nerd rank
48 / 100
Median analyst target
$6.00
Analysts covering
2
Total return, dividends reinvested
1W
−7.1%
1M
+20.0%
YTD
−11.5%
1Y
−1.0%
From 52W high
−25.9%
From 52W low
+29.9%
$3.14
$5.50
52-week range, adjusted closes · the dot is the last close
Ticker Nerd rank

GSM stock analysis: one number for the whole business

Consensus tells you what everyone already believes. The model scores Ferroglobe PLC on its factor families — the same systematic rank behind the Ticker Nerd portfolio.

Where the model ranks itAs at 21 Aug 2026
48 / 100

Percentile across ~4,600 US stocks on Ticker Nerd’s systematic factor model. Higher is better. How the model is built and tested

Growth
74
Accruals
72
Issuance
61
Revisions
52
Size
49
Value
41
Momentum
35
Volatility
33
Quality
31

Growth (74): Sales and profits are climbing, and climbing faster than before.

Quality (31): Profits are thin or unreliable for the size of the business, or they are not turning into cash.

Built and run by Aslam Ghouse, an ex-Goldman Sachs quant trader with fourteen years in markets.

Wall Street

GSM stock forecast 2026-2027: analyst price targets & predictions

The bullish and bearish analyst opinions on GSM, reported as data — targets and ratings, the market's view beside the model's.

Share price and the analyst range, 12 monthsAdjusted close, US dollars
$3.00$3.50$4.00$4.50$5.00$5.50$6.00$6.50Oct 25Jan 26Apr 26Jul 26GSMHigh $6.00Median $6.00Low $6.00

Price targets and ratings are third-party analyst estimates, reported here as data. They are not Ticker Nerd forecasts, and they are frequently wrong.

What Wall Street says2 analysts
1 Buy1 Hold0 Sell
Low $6.00Median $6.00High $6.00

The green dot is the last close — the median target sits +47.1% from it.

Recent analyst actionsNewest first
DateFirmActionRatingTarget
11 Nov 2025B. Riley SecuritiesMaintainsBuy$8.00$6.00
24 Feb 2025Seaport GlobalDowngradeNeutral
27 Feb 2023B. Riley SecuritiesMaintainsBuy
14 Sept 2022B. Riley SecuritiesInitiatesBuy
14 Feb 2022Seaport GlobalInitiatesBuy
14 Feb 2019JefferiesDowngradeHold
27 Nov 2018OppenheimerDowngradePerform
13 July 2018StifelMaintainsBuy
13 July 2018Stifel NicolausMaintainsBuy
23 May 2018B. Riley FBRMaintainsBuy
23 May 2018B. Riley SecuritiesMaintainsBuy
23 May 2018JP MorganMaintainsOverweight
5 May 2018B. Riley FBRDowngradeNeutral
26 Oct 2017StifelMaintainsBuy
26 Oct 2017Stifel NicolausMaintainsBuy
18 Aug 2017JefferiesMaintainsBuy
19 Sept 2016BairdUpgradeBuy
29 Aug 2016B. Riley SecuritiesMaintainsNeutral
29 Aug 2016StifelMaintainsBuy
29 Aug 2016Stifel NicolausMaintainsBuy

Price targets and ratings are third-party analyst estimates, reported here as data. They are not Ticker Nerd forecasts, and they are frequently wrong.

Market Radar

This page is one stock. Monday covers all of them.

Computed off the Friday close and sent before the US open.

Market Radar reports the week’s largest rank changes across roughly 4,600 US stocks, the factor behind each one, and where the market went. GSM appears on the weeks it earns a place.

Free, every Monday. Unsubscribe any time.

Estimates

GSM analyst estimate revisions

Not the forecast itself — the direction analysts are revising it. Revision direction is one of the model's factor families.

Which way the estimates are movingNext fiscal year
Analysts raising
0
Analysts cutting
1
Fundamentals

Ferroglobe PLC (GSM) financial data

A margin means little on its own. Each bar marks where the figure sits across the whole US universe we score.

Valuation
Trailing P/E
6.4×

Cheaper than 65% of US stocks

Price / sales
0.6×

Cheaper than 80% of US stocks

Price / book
1.1×

Cheaper than 71% of US stocks

EV / EBITDA
17.1×

Cheaper than 20% of US stocks

Growth & margins
Revenue growth (YoY)
−2.1%

Higher than 24% of US stocks

Earnings growth (YoY)
−2.1%

Higher than 33% of US stocks

Gross margin
44.4%

Higher than 56% of US stocks

Operating margin
15.0%

Higher than 72% of US stocks

Net margin
−3.0%

Higher than 26% of US stocks

Returns & dividend
Return on equity
−6.0%

Higher than 38% of US stocks

Return on assets
−0.8%

Higher than 40% of US stocks

Dividend yield
1.4%

Higher than 34% of US dividend payers

Bars mark the percentile across the ~4,600 US stocks Ticker Nerd covers, among those reporting the figure.

Peers

GSM vs competitors

The nearest names by industry and size, scored by the same model — like for like.

Its peer group, ranked by the same modelOther Industrial Metals & Mining
CompanyMarket capTKN rank
GSMFerroglobe PLC$777.3M
48
UAMYUnited States Antimony Corp.$787.1M
17
TMQTrilogy Metals, Inc.$681.7M
39
ALOYRealloys, Inc.$852.9M
18
CRMLCritical Metals Corp.$1.0B
33
CMPCompass Minerals International, Inc.$1.1B
99
LACLithium Americas Corp.$1.1B
9

Look up any of the roughly 4,600 stocks we score.

The rank is the raw material. Whether the rules would actually own Ferroglobe PLC — and when they’d sell — is the membership. See the Ticker Nerd 20 →

News

Latest GSM news & analysis

Ferroglobe PLC (GSM) Q2 2026 Earnings Call Transcript

Seeking Alpha · 5 Aug 2026neutral

Ferroglobe PLC held its Q2 2026 earnings call, and a transcript of the call has been published by Seeking Alpha. The transcript covers the company's quarterly results discussion.

Why it matters — A GSM watcher would care because the earnings call transcript provides the company's own account of its Q2 2026 performance and outlook.

Ferroglobe Q2 Earnings Call Highlights

MarketBeat · 5 Aug 2026positive

Ferroglobe reported higher shipments, revenue, adjusted EBITDA, and free cash flow in Q2 2026, driven by increased silicon metal volumes and stronger fixed-cost absorption, despite ongoing import pricing pressure.

Why it matters — The improvement in key financial metrics signals that Ferroglobe is managing to grow its business and profitability even in a challenging pricing environment.

Globe Specialty Metals (GSM) Reports Break-Even Earnings for Q2

Zacks Investment Research · 5 Aug 2026positive

Globe Specialty Metals reported break-even earnings per share for Q2, versus the Zacks Consensus Estimate of a loss of $0.07 per share. This compares with a loss of $0.08 per share in the same quarter a year ago.

Why it matters — A GSM watcher would care because the company came in better than analysts expected and improved on its year-ago loss.

Ferroglobe Reports Second Quarter 2026 Financial Results

GlobeNewsWire · 4 Aug 2026positive

Ferroglobe reported second quarter 2026 results with sequential shipment growth driven by increased silicon metal volumes in EMEA and the U.S., adjusted EBITDA of $13.1 million, total cash of $93.2 million and net debt of $37.7 million. Second-quarter sales were $378.6 million, and net profit attributable to the parent was $60.4 million versus a loss in the prior quarter. The company noted advancing critical materials initiatives and paid a quarterly dividend of $0.015 per share on June 30, with a matching dividend payable on September 29.

Why it matters — The quarter shows a swing to profitability from a prior-period loss, stronger shipments and a stable dividend, alongside cash and debt levels and progress on strategic critical materials initiatives relevant to Western supply chains.

FAQ

Frequently asked questions about GSM stock

What is the GSM stock price forecast for 2026-2027?

The 2 Wall Street analysts covering Ferroglobe PLC have a median 12-month price target of $6, with estimates ranging from $6 to $6. These are third-party analyst estimates, not Ticker Nerd forecasts, and they are frequently wrong.

Is GSM stock a buy right now?

Of the 2 analysts covering Ferroglobe PLC, 1 rate it a Buy, 1 a Hold and 0 a Sell. Ticker Nerd's systematic factor model ranks Ferroglobe PLC 48 out of 100 across roughly 4,600 US stocks as at 21 Aug 2026. None of this is personal advice — it does not consider your circumstances.

How does Ticker Nerd's model rank GSM?

As at 21 Aug 2026, Ferroglobe PLC ranks 48 out of 100 on Ticker Nerd's systematic factor model — a percentile across roughly 4,600 US stocks, built from its factor families. Its strongest factor family is Growth (74 of 100).

Will GSM stock go up?

No one can know that. What the data says: the median 12-month target from 2 analysts implies +47.1% from the last close, and Ticker Nerd's factor model ranks Ferroglobe PLC 48 out of 100 as at 21 Aug 2026. Analyst targets are third-party estimates and frequently wrong; none of this is personal advice.

What is the GSM stock forecast for 2030?

No analyst covering Ferroglobe PLC publishes a 2030 price target — Wall Street targets run 12 to 18 months out. Sites quoting a 2030 price for GSM are extrapolating price history, which says nothing about the business. The furthest attributed numbers are the current analyst targets: $6 to $6 over the next 12 months.

How has GSM stock performed over the past year?

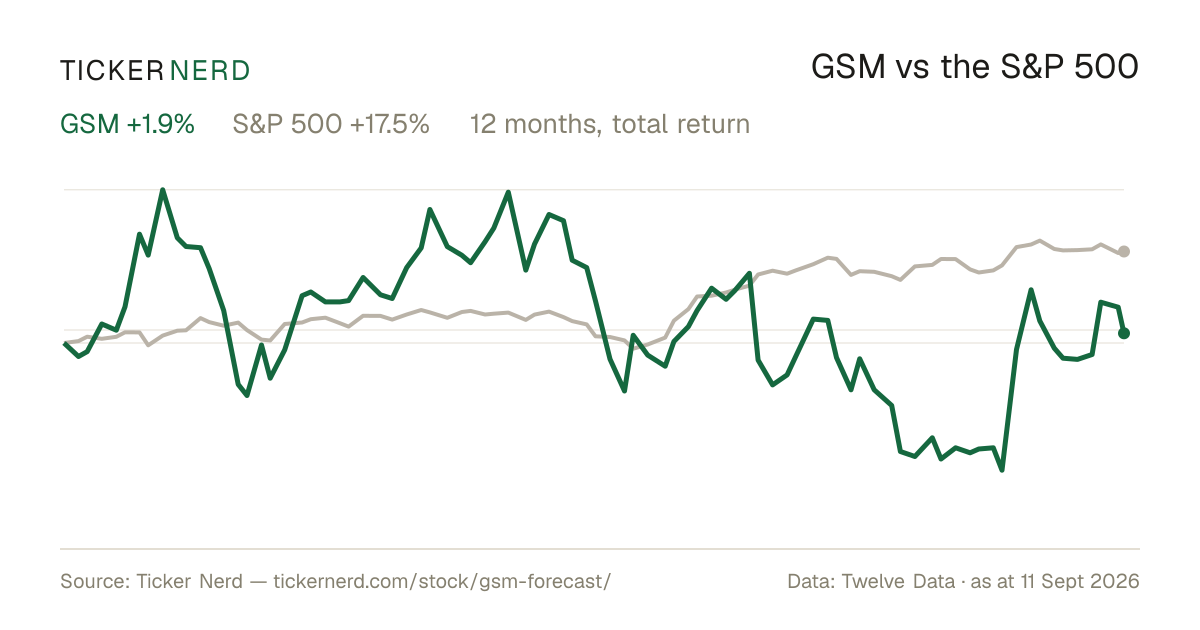
Ferroglobe PLC returned -1.0% over the 12 months to 21 Aug 2026, with dividends reinvested. Past performance does not indicate future returns.

What does Ferroglobe PLC do?

Ferroglobe PLC is a leading producer of silicon and specialty metals, focusing on the manufacturing and supply of silicon-based products, metal alloys, and mineral raw materials. The company plays a crucial role in the metal and mining sector, providing essential components used in the fabrication of various industrial and consumer goods.

What is the latest news on GSM?

The most recent item we track (Seeking Alpha, 5 Aug 2026): "Ferroglobe PLC (GSM) Q2 2026 Earnings Call Transcript". Ferroglobe PLC held its Q2 2026 earnings call, and a transcript of the call has been published by Seeking Alpha. The transcript covers the company's quarterly results discussion.

Company

About Ferroglobe PLC.

Ferroglobe PLC is a leading producer of silicon and specialty metals, focusing on the manufacturing and supply of silicon-based products, metal alloys, and mineral raw materials. The company plays a crucial role in the metal and mining sector, providing essential components used in the fabrication of various industrial and consumer goods. Its primary function is to supply high-purity silicon, silicon-based alloys, and manganese-based alloys, which are integral to numerous industries, including automotive, construction, solar energy, and electronics. With significant operations situated in the United States and Europe, Ferroglobe's strategic presence spans vital markets and caters to a global clientele. By managing a diversified portfolio of mining, production, and distribution facilities, Ferroglobe ensures a reliable supply chain for its customers. The company's role in the market is significant due to its large production capacity and extensive distribution networks, which help meet the growing demand for high-quality metallic and mineral solutions worldwide. With its commitment to sustainable practices and technological advancement, Ferroglobe continues to impact various sectors, influencing industrial transformations and efficiency improvements.

CEO Dr. Marco Levi · 2,920 employees · United Kingdom · https://www.ferroglobe.com