HSDTHSDTFinancial Services · Asset Management

HSDT Stock Forecast: Solana Co. Price Predictions for 2026-2027

Last close, 9 Oct 2026
$2.39
+0.42% on the day

The 2 Wall Street analysts covering Solana Co. hold a median 12-month price target of $3.5 — +46.4% from the last close. Ticker Nerd's systematic factor model, run across ~4,600 US stocks, ranks it 27 of 100 as at 8 Oct 2026 — in the lower half. The Street sees upside; the factor read is a caution. That gap is the story on this page.

Market cap
$165.4M
Ticker Nerd rank
27 / 100
Median analyst target
$3.50
Analysts covering
2
Revenue$2.5M+5774.4% y/y
Operating income−$8.7M
Net income−$30.3M
Free cash flow−$11.9M
Quarterly, 8 quarters to 30 June 2026 · latest quarter's figure shown
Total return, dividends reinvested
1W
−9.1%
1M
+8.6%
YTD
−17.3%
1Y
−85.8%
From 52W high
−85.8%
From 52W low
+88.2%
$1
$17
52-week range, adjusted closes · the dot is the last close
Ticker Nerd rank

HSDT stock analysis: one number for the whole business

Consensus tells you what everyone already believes. The model scores Solana Co. on its factor families — the same systematic rank behind the Ticker Nerd portfolio.

Where the model ranks itAs at 8 Oct 2026
27 / 100

Percentile across ~4,600 US stocks on Ticker Nerd’s systematic factor model. Higher is better. How the model is built and tested

Growth
72
Size
72
Volatility
62
Value
48
Revisions
42
Momentum
33
Quality
29
Issuance
22
Accruals
9

Growth (72): Sales and profits are climbing, and climbing faster than before.

Accruals (9): A large share of reported profit has not shown up as cash, or the balance sheet is expanding quickly — both tend to unwind.

Built and run by Aslam Ghouse, an ex-Goldman Sachs quant trader with fourteen years in markets.

Wall Street

HSDT stock forecast 2026-2027: analyst price targets & predictions

The bullish and bearish analyst opinions on HSDT, reported as data — targets and ratings, the market's view beside the model's.

Share price and the analyst range, 12 monthsAdjusted close, US dollars
$0$5$10$15Jan 26Apr 26Jul 26Oct 26HSDTHigh $4.00Median $3.50Low $3.00

Price targets and ratings are third-party analyst estimates, reported here as data. They are not Ticker Nerd forecasts, and they are frequently wrong.

Data provided by Twelve Data

What Wall Street says2 analysts
2 Buy0 Hold0 Sell
Low $3.00Median $3.50High $4.00

The green dot is the last close — the median target sits +46.4% from it.

Recent analyst actionsNewest first

Of the 19 most recent actions, 2 moved their price target up and 1 moved it down.

DateFirmActionRatingTarget
22 Sept 2026B. Riley SecuritiesMaintainsBuy$3.50 → $4.00
3 Sept 2026B. Riley SecuritiesMaintainsBuy—
3 Sept 2026B. Riley SecuritiesMaintainsBuy$2.50 → $3.50
17 Aug 2026B. Riley SecuritiesMaintainsBuy—
17 Aug 2026B. Riley SecuritiesMaintainsBuy$3.00 → $2.50
6 Apr 2026Maxim GroupAssumesBuy$4.00
16 Oct 2024Maxim GroupDowngradeHold—
5 Mar 2024Roth MKMMaintainsBuy—
20 Dec 2022Maxim GroupInitiatesBuy$1.00
23 Aug 2022Roth CapitalInitiatesBuy$5.00
15 Nov 2021Noble Capital MarketsDowngradeMarket Perform—
24 Mar 2021Noble Capital MarketsInitiatesOutperform$20
16 Apr 2019BTIG ResearchDowngradeNeutral—
11 Apr 2019OppenheimerDowngradePerform—
6 Mar 2019OppenheimerInitiatesOutperform—
20 Nov 2018BTIG ResearchUpgradeBuy—
20 June 2018BTIG ResearchDowngradeNeutral—
19 June 2018BTIG ResearchDowngradeNeutral—
17 May 2018BTIG ResearchInitiatesBuy—

Price targets and ratings are third-party analyst estimates, reported here as data. They are not Ticker Nerd forecasts, and they are frequently wrong.

Market Radar

This page is one stock. Monday covers all of them.

Computed off the Friday close and sent before the US open.

Market Radar reports the week’s largest rank changes across roughly 4,600 US stocks, the factor behind each one, and where the market went. HSDT appears on the weeks it earns a place.

Free, every Monday. Unsubscribe any time.

Performance

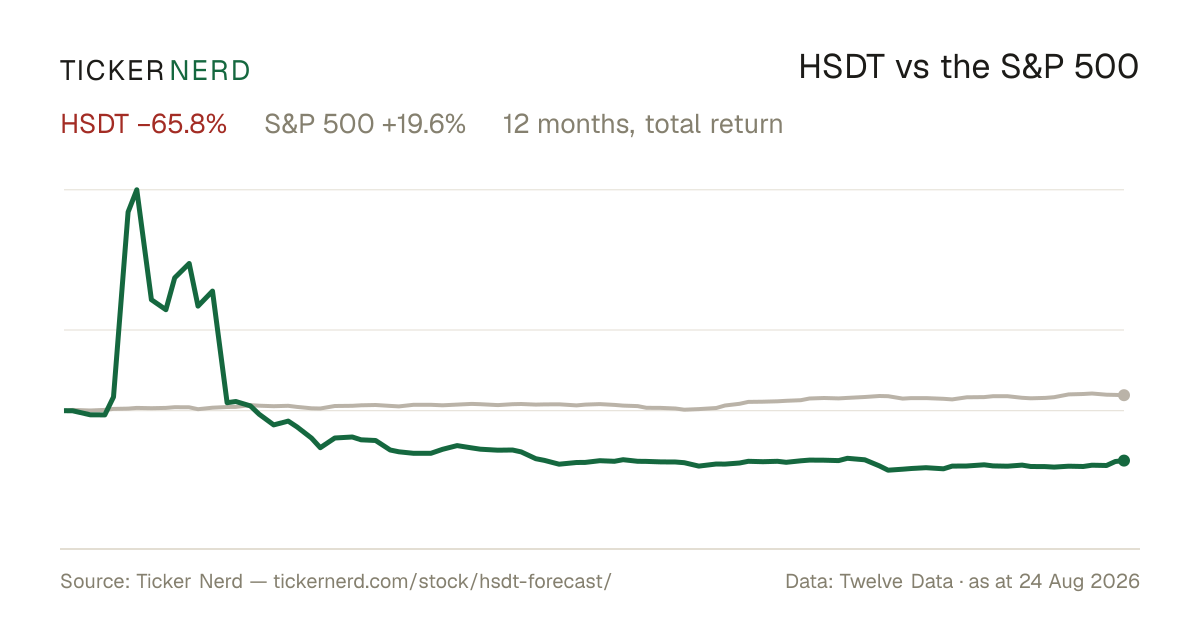
HSDT vs the S&P 500

Both lines are total return — dividends reinvested — so the comparison is honest on both sides.

Over the twelve months to 9 Oct 2026, Solana Co. returned −85.8% against +16.6% for the S&P 500, dividends included.

HSDT vs S&P 500, last 12 monthsTotal return, rebased to 100
020406080100120Jan 26Apr 26Jul 26Oct 26HSDTS&P 500

Download this chart as an image — free to reuse; link this page as the source.

Data provided by Twelve Data

Estimates

HSDT analyst estimate revisions

Not the forecast itself — the direction analysts are revising it. Revision direction is one of the model's factor families.

Which way the estimates are movingNext fiscal year
Analysts raising
0
Analysts cutting
2
Fundamentals

Solana Co. (HSDT) financial data

A margin means little on its own. Each bar marks where the figure sits across the whole US universe we score.

Valuation
Trailing P/E
0.0×

Cheaper than 73% of US stocks

Price / sales
13.7×

Cheaper than 12% of US stocks

Price / book
0.9×

Cheaper than 74% of US stocks

EV / EBITDA
−0.4×

Cheaper than 64% of US stocks

Growth & margins
Revenue growth (YoY)
5774.4%

Higher than 99% of US stocks

Earnings growth (YoY)
5774.4%

Higher than 99% of US stocks

Gross margin
97.0%

Higher than 99% of US stocks

Operating margin
−1293.5%

Higher than 5% of US stocks

Net margin
91.7%

Higher than 99% of US stocks

Returns & dividend
Return on equity
−179.0%

Higher than 8% of US stocks

Return on assets
−250.6%

Higher than 1% of US stocks

Dividend yield
0.0%

Higher than 1% of US dividend payers

Bars mark the percentile across the ~4,600 US stocks Ticker Nerd covers, among those reporting the figure.

Key statistics

Solana Co. (HSDT) statistics: revenue, profit & scale

The headline figures, each with its date. Every row carries its own link — cite it straight from here.

  • Solana Co. has a market value of $165.4M and an enterprise value of $149.9M.

  • Revenue in the twelve months to 30 June 2026: $12.1M. The latest quarter grew 5774.4% year on year.

  • Net income over the same four quarters: −$157.3M, a −1302.8% net margin.

  • Free cash flow in the twelve months to 30 June 2026: −$71.7M.

  • Shares outstanding: 60.5M.

  • Trailing P/E: 0.0×; forward P/E: −23.1× — the forward figure prices analyst consensus estimates, not reported earnings.

  • Forward dividend yield: 0.00%, paying out 0% of earnings.

  • Solana Co. employs 21 people — $575K of revenue per employee.

Statement figures: company filings via Twelve Data, four quarters to 30 June 2026 · market figures as at 8 Oct 2026

Data provided by Twelve Data

Peers

HSDT vs competitors

The nearest names by industry and size, scored by the same model — like for like.

Its peer group, ranked by the same modelAsset Management
CompanyMarket capTKN rank
HSDTSolana Co.$165.4M
27
DFDVDeFi Development Corp.$149.4M
30
SAMGSilvercrest Asset Management Group, Inc.$120.0M
57
WHGWestwood Holdings Group, Inc.$182.1M
85
SDEVStablecoin Development Corp.$100.4M
3
ZSTKZeroStack Corp.$100.3M
38
MGLDThe Marygold Cos, Inc.$85.6M
90

Look up any of the roughly 4,600 stocks we score.

The rank is the raw material. Whether the rules would actually own Solana Co. — and when they’d sell — is the membership. See the Ticker Nerd 20 →

News

Latest HSDT news & analysis

Solana Company (HSDT) Now Trades Above Golden Cross: Time to Buy?

Zacks Investment Research · 2 Oct 2026positive

Zacks reports that Solana Company (HSDT) has reached a key support level, with its 50-day simple moving average crossing above its 200-day simple moving average—a technical pattern known as a "golden cross." The move is presented as a potentially notable development from a technical-analysis standpoint.

Why it matters — HSDT watchers may view the golden cross as a technically favorable signal indicating improved momentum in the stock.

Solana Company (NASDAQ: HSDT) Announces Pricing of $15 Million Registered Direct Offering with a Global Institutional Investor

GlobeNewsWire · 30 Sept 2026neutral

Solana Company (NASDAQ: HSDT) announced that it entered into a securities purchase agreement with a single institutional investor for a registered direct offering of 4,369,356 shares of Class A common stock at $3.433 per share, with accompanying warrants to purchase up to 4,369,356 shares at $3.776 per share. The offering is priced at a 5% premium to NAV for the shares and a 10% premium to NAV for the warrants' exercise price.

Why it matters — This capital raise provides HSDT with additional funding and institutional participation, and the share and warrant pricing above Net Asset Value offers a reference point for the company's NAV-based valuation.

Is the Options Market Predicting a Spike in Solana Company Stock?

Zacks Investment Research · 21 Sept 2026neutral

Zacks Investment Research highlights that recent movements in the options market could signal a potential spike in Solana Company (HSDT) stock, urging investors to pay close attention to the shares.

Why it matters — HSDT watchers would care because unusual options activity could indicate where market participants expect the stock to move.

Solana Company Announces Positions and Votes on first Solana Governance Proposals

GlobeNewsWire · 21 Aug 2026neutral

Solana Company (HSDT), a digital asset treasury company and operator of institutional Solana validator infrastructure across Asia-Pacific, announced its positions on the first three Solana Governance Proposals ahead of on-chain voting expected to open on 22 August 2026.

Why it matters — The announcement shows HSDT actively participating in Solana's governance process, which is relevant given its role as an institutional validator infrastructure operator.

Solana Company (HSDT) Q2 2026 Earnings Call Transcript

Seeking Alpha · 15 Aug 2026neutral

Seeking Alpha published the transcript of Solana Company's (HSDT) Q2 2026 earnings call. The item is a record of the company's earnings call proceedings for that quarter.

Why it matters — An earnings call transcript gives HSDT watchers access to management's own commentary on the company's quarterly results and outlook.

FAQ

Frequently asked questions about HSDT stock

What is the HSDT stock price forecast for 2026-2027?

The 2 Wall Street analysts covering Solana Co. have a median 12-month price target of $3.5, with estimates ranging from $3 to $4. These are third-party analyst estimates, not Ticker Nerd forecasts, and they are frequently wrong.

Is HSDT stock a buy right now?

Of the 2 analysts covering Solana Co., 2 rate it a Buy, 0 a Hold and 0 a Sell. Ticker Nerd's systematic factor model ranks Solana Co. 27 out of 100 across roughly 4,600 US stocks as at 8 Oct 2026. None of this is personal advice — it does not consider your circumstances.

How does Ticker Nerd's model rank HSDT?

As at 8 Oct 2026, Solana Co. ranks 27 out of 100 on Ticker Nerd's systematic factor model — a percentile across roughly 4,600 US stocks, built from its factor families. Its strongest factor family is Growth (72 of 100).

Will HSDT stock go up?

No one can know that. What the data says: the median 12-month target from 2 analysts implies +46.4% from the last close, and Ticker Nerd's factor model ranks Solana Co. 27 out of 100 as at 8 Oct 2026. Analyst targets are third-party estimates and frequently wrong; none of this is personal advice.

What is the HSDT stock forecast for 2030?

No analyst covering Solana Co. publishes a 2030 price target — Wall Street targets run 12 to 18 months out. Sites quoting a 2030 price for HSDT are extrapolating price history, which says nothing about the business. The furthest attributed numbers are the current analyst targets: $3 to $4 over the next 12 months.

How has HSDT stock performed over the past year?

Solana Co. returned -85.8% over the 12 months to 9 Oct 2026, with dividends reinvested. Past performance does not indicate future returns.

What does Solana Co. do?

Solana Company Class A Common Stock is the equity of Solana Company, a Newtown, Pennsylvania-based company focused on a digital asset treasury model centered on acquiring and holding Solana tokens. The company’s current business combines capital markets activity with blockchain-related treasury management, positioning its shares as a representation of exposure to Solana-focused corporate asset management rather than a traditional operating business.

What is the latest news on HSDT?

The most recent item we track (Zacks Investment Research, 2 Oct 2026): "Solana Company (HSDT) Now Trades Above Golden Cross: Time to Buy?". Zacks reports that Solana Company (HSDT) has reached a key support level, with its 50-day simple moving average crossing above its 200-day simple moving average—a technical pattern known as a "golden cross." The move is presented as a potentially notable development from a technical-analysis standpoint.

Company

About Solana Co.

Solana Company Class A Common Stock is the equity of Solana Company, a Newtown, Pennsylvania-based company focused on a digital asset treasury model centered on acquiring and holding Solana tokens. The company’s current business combines capital markets activity with blockchain-related treasury management, positioning its shares as a representation of exposure to Solana-focused corporate asset management rather than a traditional operating business. In addition to its treasury activities, Solana Company retains a legacy neurotechnology segment that includes non-implantable medical devices for neurological wellness. Its Class A common stock is used by investors to track the company’s evolving business mix across digital assets and medical technology. As a publicly listed security, it participates in the broader market for small-cap stocks tied to alternative asset strategies and specialized healthcare technologies.

CEO Mr. Choon Wee Chee · 21 employees · United States · https://www.solanacompany.co