IOTIOTTechnology · Software - Infrastructure

IOT Stock Forecast: Samsara, Inc. Price Predictions for 2026-2027

Last close, 3 Aug 2026
$37
−0.38% on the day

The 23 Wall Street analysts covering Samsara, Inc. hold a median 12-month price target of $44 — +18.5% from the last close. Ticker Nerd's systematic factor model, run across ~4,600 US stocks, ranks it 68 of 100 as at 1 Aug 2026 — in the upper half.

Market cap
$21.7B
Ticker Nerd rank
68 / 100
Median analyst target
$44
Analysts covering
23
Total return, dividends reinvested
1W
+5.1%
1M
+3.3%
YTD
+4.7%
1Y
+3.1%
From 52W high
−17.9%
From 52W low
+53.1%
$24
$45
52-week range, adjusted closes · the dot is the last close
Ticker Nerd rank

IOT stock analysis: one number for the whole business

Consensus tells you what everyone already believes. The model scores Samsara, Inc. on its factor families — the same systematic rank behind the Ticker Nerd portfolio.

Where the model ranks itAs at 1 Aug 2026
68 / 100

Percentile across ~4,600 US stocks on Ticker Nerd’s systematic factor model. Higher is better. How the model is built and tested

Revisions
99
Quality
86
Issuance
61
Growth
60
Accruals
60
Volatility
53
Momentum
40
Value
32
Size
10

Revisions (99): Analysts have, on balance, been raising their forecasts.

Value (32): The shares cost a lot relative to the profits and assets behind them.

Size (10): Larger than most of the companies we track — more scrutinised, less often mispriced.

The rank is the raw material. Whether the rules would actually own Samsara, Inc. — and when they’d sell — is the membership.

Wall Street

IOT stock forecast 2026-2027: analyst price targets & predictions

The bullish and bearish analyst opinions on IOT, reported as data — targets and ratings, the market's view beside the model's.

Share price and the analyst range, 12 monthsAdjusted close, US dollars
$20$30$40$50$60Oct 25Jan 26Apr 26Jul 26IOTHigh $58Median $44Low $30

Price targets and ratings are third-party analyst estimates, reported here as data. They are not Ticker Nerd forecasts, and they are frequently wrong.

What Wall Street says23 analysts
18 Buy5 Hold0 Sell
Low $30Median $44High $58

The green dot is the last close — the median target sits +18.5% from it.

Recent analyst actionsNewest first
DateFirmActionRatingTarget
23 July 2026GuggenheimInitiatesBuy$45
26 June 2026BTIGReiteratesBuy$45
26 June 2026BTIGReiteratesBuy
25 June 2026TD CowenReiteratesBuy$45
25 June 2026TD CowenReiteratesBuy
5 June 2026BTIGReiteratesBuy
5 June 2026Piper SandlerReiteratesOverweight
5 June 2026RBC CapitalMaintainsOutperform
5 June 2026Wells FargoMaintainsOverweight
6 Mar 2026BMO CapitalMaintainsOutperform
6 Mar 2026BTIGMaintainsBuy
6 Mar 2026KeybancMaintainsOverweight
6 Mar 2026Piper SandlerReiteratesOverweight
6 Mar 2026RBC CapitalMaintainsOutperform
6 Mar 2026Wells FargoMaintainsOverweight
27 Feb 2026KeybancMaintainsOverweight
17 Feb 2026Truist SecuritiesMaintainsHold
6 Feb 2026Piper SandlerReiteratesOverweight
4 Feb 2026Wells FargoMaintainsOverweight
5 Jan 2026RBC CapitalMaintainsOutperform

Price targets and ratings are third-party analyst estimates, reported here as data. They are not Ticker Nerd forecasts, and they are frequently wrong.

Estimates

IOT analyst estimate revisions

Not the forecast itself — the direction analysts are revising it. Revision direction is one of the model's factor families.

Which way the estimates are movingNext fiscal year
EPS revision, 90 days
+4.5%
Analysts raising
18
Analysts cutting
0
Fundamentals

Samsara, Inc. (IOT) financial data

A margin means little on its own. Each bar marks where the figure sits across the whole US universe we score.

Valuation
Trailing P/E
372.7×

Cheaper than 2% of US stocks

Price / sales
13.4×

Cheaper than 12% of US stocks

Price / book
14.4×

Cheaper than 7% of US stocks

EV / EBITDA
−16240.2×

Cheaper than 99% of US stocks

Growth & margins
Revenue growth (YoY)
30.5%

Higher than 80% of US stocks

Earnings growth (YoY)
30.5%

Higher than 69% of US stocks

Gross margin
75.4%

Higher than 87% of US stocks

Operating margin
1.5%

Higher than 51% of US stocks

Net margin
3.3%

Higher than 56% of US stocks

Returns & dividend
Return on equity
4.4%

Higher than 52% of US stocks

Return on assets
−0.3%

Higher than 42% of US stocks

Dividend yield

Bars mark the percentile across the ~4,600 US stocks Ticker Nerd covers, among those reporting the figure.

Peers

IOT vs competitors

The nearest names by industry and size, scored by the same model — like for like.

Its peer group, ranked by the same modelSoftware - Infrastructure
CompanyMarket capTKN rank
IOTSamsara, Inc.$21.7B
68
FFIVF5, Inc.$22.8B
92
ZSZscaler, Inc.$24.3B
41
TOSTToast, Inc.$18.7B
43
OKTAOkta, Inc.$24.9B
80
CPAYCorpay, Inc.$25.3B
70
VRSNVeriSign, Inc.$26.6B
72
Market Radar

This page is one stock. Monday covers all of them.

Computed off the Friday close and sent before the US open.

Market Radar reports the week’s largest rank changes across roughly 4,600 US stocks, the factor behind each one, and where the market went. IOT appears on the weeks it earns a place.

Free, every Monday. Unsubscribe any time.

News

Latest IOT news & analysis

Samsara Inc. (IOT) Stock Falls Amid Market Uptick: What Investors Need to Know

Zacks Investment Research · 30 July 2026negative

Samsara Inc. (IOT) shares fell 7.61% in the most recent trading day, closing at $35.8, even as the broader market moved higher.

Why it matters — The stock declined sharply despite a rising market, which may signal company-specific weakness rather than broader market conditions.

Samsara Inc. (IOT) Crossed Above the 200-Day Moving Average: What That Means for Investors

Zacks Investment Research · 28 July 2026positive

According to Zacks Investment Research, Samsara Inc. (IOT) crossed above its 200-day moving average, a key technical level that suggests a long-term bullish trend.

Why it matters — IOT watchers would care because crossing above the 200-day moving average is a widely watched technical indicator that can signal a shift toward a bullish long-term trend for the stock.

Samsara Inc. (IOT) Just Reclaimed the 50-Day Moving Average

Zacks Investment Research · 28 July 2026positive

Samsara Inc. (IOT) surpassed resistance at its 50-day moving average, reclaiming what the article describes as an important support level.

Why it matters — A move back above the 50-day moving average is often viewed as a technical indicator of a short-term bullish trend, which IOT watchers may monitor for signs of momentum.

Wall Street Analysts See a 36.87% Upside in Samsara Inc. (IOT): Can the Stock Really Move This High?

Zacks Investment Research · 24 July 2026positive

A Zacks Investment Research report highlights that the average of Wall Street analysts' price targets suggests a 36.9% potential upside for Samsara Inc. (IOT), though it questions the reliability of this metric while noting that positive earnings estimate revisions could support gains.

Why it matters — IOT watchers would take note of the positive earnings estimate revisions, as actual earnings momentum may be a more meaningful indicator than the headline price-target average.

Why Samsara Inc. (IOT) Dipped More Than Broader Market Today

Zacks Investment Research · 23 July 2026negative

Samsara Inc. (IOT) shares closed at $31.49 in the latest trading session, falling 5.52% from the previous day and declining more than the broader market.

Why it matters — A share price decline of more than 5% in a single session, especially one that outpaces the broader market, is a notable move that could signal shifting investor sentiment toward IOT.

FAQ

Frequently asked questions about IOT stock

What is the IOT stock price forecast for 2026-2027?

The 23 Wall Street analysts covering Samsara, Inc. have a median 12-month price target of $44, with estimates ranging from $30 to $58. These are third-party analyst estimates, not Ticker Nerd forecasts, and they are frequently wrong.

Is IOT stock a buy right now?

Of the 23 analysts covering Samsara, Inc., 18 rate it a Buy, 5 a Hold and 0 a Sell. Ticker Nerd's systematic factor model ranks Samsara, Inc. 68 out of 100 across roughly 4,600 US stocks as at 1 Aug 2026. None of this is personal advice — it does not consider your circumstances.

How does Ticker Nerd's model rank IOT?

As at 1 Aug 2026, Samsara, Inc. ranks 68 out of 100 on Ticker Nerd's systematic factor model — a percentile across roughly 4,600 US stocks, built from its factor families. Its strongest factor family is Revisions (99 of 100).

Will IOT stock go up?

No one can know that. What the data says: the median 12-month target from 23 analysts implies +18.5% from the last close, and Ticker Nerd's factor model ranks Samsara, Inc. 68 out of 100 as at 1 Aug 2026. Analyst targets are third-party estimates and frequently wrong; none of this is personal advice.

What is the IOT stock forecast for 2030?

No analyst covering Samsara, Inc. publishes a 2030 price target — Wall Street targets run 12 to 18 months out. Sites quoting a 2030 price for IOT are extrapolating price history, which says nothing about the business. The furthest attributed numbers are the current analyst targets: $30 to $58 over the next 12 months.

How has IOT stock performed over the past year?

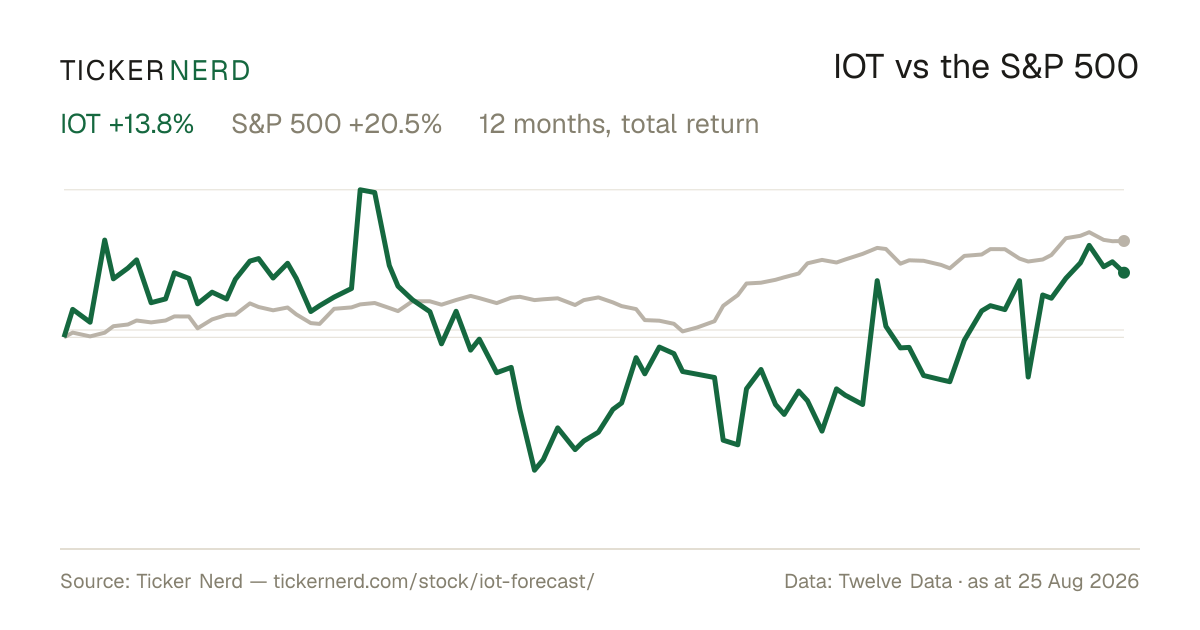
Samsara, Inc. returned +3.1% over the 12 months to 3 Aug 2026, with dividends reinvested. Past performance does not indicate future returns.

What does Samsara, Inc. do?

Samsara Inc. Class A Common Stock represents ownership in Samsara Inc., a software company focused on the Internet of Things and connected operations.

What is the latest news on IOT?

The most recent item we track (Zacks Investment Research, 30 July 2026): "Samsara Inc. (IOT) Stock Falls Amid Market Uptick: What Investors Need to Know". Samsara Inc. (IOT) shares fell 7.61% in the most recent trading day, closing at $35.8, even as the broader market moved higher.

Company

About Samsara, Inc.

Samsara Inc. Class A Common Stock represents ownership in Samsara Inc., a software company focused on the Internet of Things and connected operations. Samsara provides a cloud-based Connected Operations Platform that integrates data from vehicles, equipment, sites, and frontline workers to deliver real-time visibility and analytics for organizations with physical operations. Its core offerings span fleet management, driver safety with AI-enabled video, equipment monitoring, asset tracking, and workflow applications used to enhance safety, compliance, and operational efficiency across complex field operations. The company serves a broad range of industries, including transportation and logistics, construction, manufacturing, utilities and energy, wholesale and retail trade, government, and healthcare. By aggregating telematics, sensor, and camera data into a unified cloud platform, Samsara plays a significant role in the digitalization of industrial and field-based operations. Founded in 2015 and headquartered in San Francisco, California, it operates in North America and Europe, supporting tens of thousands of enterprise and mid-market customers.

CEO Mr. Sanjit Biswas · 4,100 employees · United States · https://www.samsara.com