KEQU Stock Forecast: Kewaunee Scientific Corp. Price Predictions for 2026-2027
Ticker Nerd's systematic factor model, run across ~4,600 US stocks, ranks it 66 of 100 as at 22 Aug 2026 — in the upper half.
KEQU stock analysis: one number for the whole business
Consensus tells you what everyone already believes. The model scores Kewaunee Scientific Corp. on its factor families — the same systematic rank behind the Ticker Nerd portfolio.
Percentile across ~4,600 US stocks on Ticker Nerd’s systematic factor model. Higher is better. How the model is built and tested
Issuance (90): The share count has been shrinking and the company is not leaning on new borrowing.
Momentum (5): The shares have been drifting down relative to others.
Built and run by Aslam Ghouse, an ex-Goldman Sachs quant trader with fourteen years in markets.
KEQU stock forecast 2026-2027: analyst price targets & predictions
The bullish and bearish analyst opinions on KEQU, reported as data — targets and ratings, the market's view beside the model's.
Price targets and ratings are third-party analyst estimates, reported here as data. They are not Ticker Nerd forecasts, and they are frequently wrong.
This page is one stock. Monday covers all of them.
Computed off the Friday close and sent before the US open.
Market Radar reports the week’s largest rank changes across roughly 4,600 US stocks, the factor behind each one, and where the market went. KEQU appears on the weeks it earns a place.
KEQU analyst estimate revisions
Not the forecast itself — the direction analysts are revising it. Revision direction is one of the model's factor families.
Kewaunee Scientific Corp. (KEQU) financial data
A margin means little on its own. Each bar marks where the figure sits across the whole US universe we score.
- Trailing P/E
- 11.5×
- Price / sales
- 0.4×
- Price / book
- 1.4×
- EV / EBITDA
- 6.8×
Cheaper than 56% of US stocks
Cheaper than 87% of US stocks
Cheaper than 60% of US stocks
Cheaper than 50% of US stocks
- Revenue growth (YoY)
- −7.5%
- Earnings growth (YoY)
- −30.1%
- Gross margin
- 29.8%
- Operating margin
- 7.3%
- Net margin
- 3.4%
Higher than 18% of US stocks
Higher than 15% of US stocks
Higher than 35% of US stocks
Higher than 59% of US stocks
Higher than 56% of US stocks
- Return on equity
- 14.6%
- Return on assets
- 5.6%
- Dividend yield
- 2.1%
Higher than 73% of US stocks
Higher than 79% of US stocks
Higher than 46% of US dividend payers
Bars mark the percentile across the ~4,600 US stocks Ticker Nerd covers, among those reporting the figure.
KEQU vs competitors
The nearest names by industry and size, scored by the same model — like for like.
Look up any of the roughly 4,600 stocks we score.
The rank is the raw material. Whether the rules would actually own Kewaunee Scientific Corp. — and when they’d sell — is the membership. See the Ticker Nerd 20 →
Frequently asked questions about KEQU stock
Is KEQU stock a buy right now?
Of the 1 analysts covering Kewaunee Scientific Corp., 1 rate it a Buy, 0 a Hold and 0 a Sell. Ticker Nerd's systematic factor model ranks Kewaunee Scientific Corp. 66 out of 100 across roughly 4,600 US stocks as at 22 Aug 2026. None of this is personal advice — it does not consider your circumstances.
How does Ticker Nerd's model rank KEQU?
As at 22 Aug 2026, Kewaunee Scientific Corp. ranks 66 out of 100 on Ticker Nerd's systematic factor model — a percentile across roughly 4,600 US stocks, built from its factor families. Its strongest factor family is Issuance (90 of 100).
What is the KEQU stock forecast for 2030?
No analyst covering Kewaunee Scientific Corp. publishes a 2030 price target — Wall Street targets run 12 to 18 months out. Sites quoting a 2030 price for KEQU are extrapolating price history, which says nothing about the business.
How has KEQU stock performed over the past year?
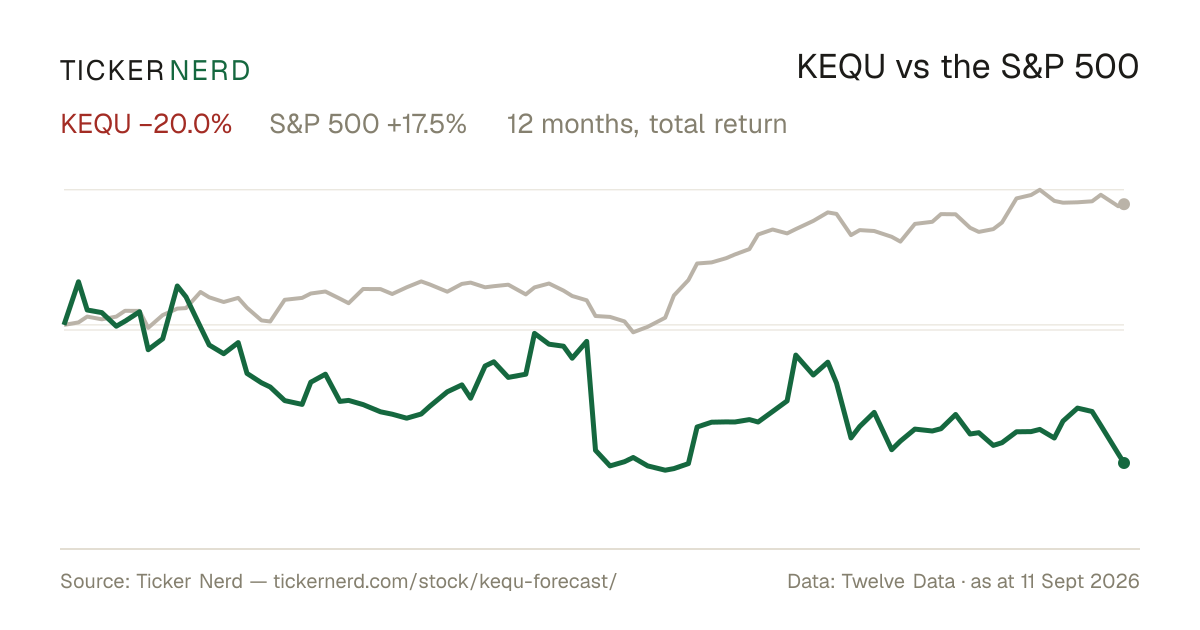
Kewaunee Scientific Corp. returned -36.0% over the 12 months to 20 Aug 2026, with dividends reinvested. Past performance does not indicate future returns.
What does Kewaunee Scientific Corp. do?
Kewaunee Scientific Corporation, a prominent player in the industrial and commercial sector, specializes in the design, manufacture, and installation of laboratory, healthcare, and technical furniture products. The company provides comprehensive solutions that support critical environments, offering products such as workstations, cabinetry, and storage solutions tailored to demanding environments in scientific research institutions, hospitals, and educational facilities.
About Kewaunee Scientific Corp.
Kewaunee Scientific Corporation, a prominent player in the industrial and commercial sector, specializes in the design, manufacture, and installation of laboratory, healthcare, and technical furniture products. The company provides comprehensive solutions that support critical environments, offering products such as workstations, cabinetry, and storage solutions tailored to demanding environments in scientific research institutions, hospitals, and educational facilities. Known for its commitment to quality and innovation, Kewaunee Scientific Corporation serves a global clientele, emphasizing custom-designed solutions to meet specific client needs. Headquartered in Statesville, North Carolina, the corporation plays a vital role in advancing the infrastructure required for scientific research and healthcare improvements. In addition to its standard product offerings, Kewaunee's focus on continually improving product design and manufacturing processes underscores its significance in supporting the technological and research developments of various industries. The company's contributions significantly impact industries where accuracy, reliability, and safety are paramount.
CEO Mr. Thomas David Hull III · 1,231 employees · United States · https://kewaunee.com