MANEHealthcare · Biotechnology

MANE Stock Forecast: Veradermics, Inc. Price Predictions for 2026-2027

Last close, 3 Aug 2026
$102
−2.96% on the day

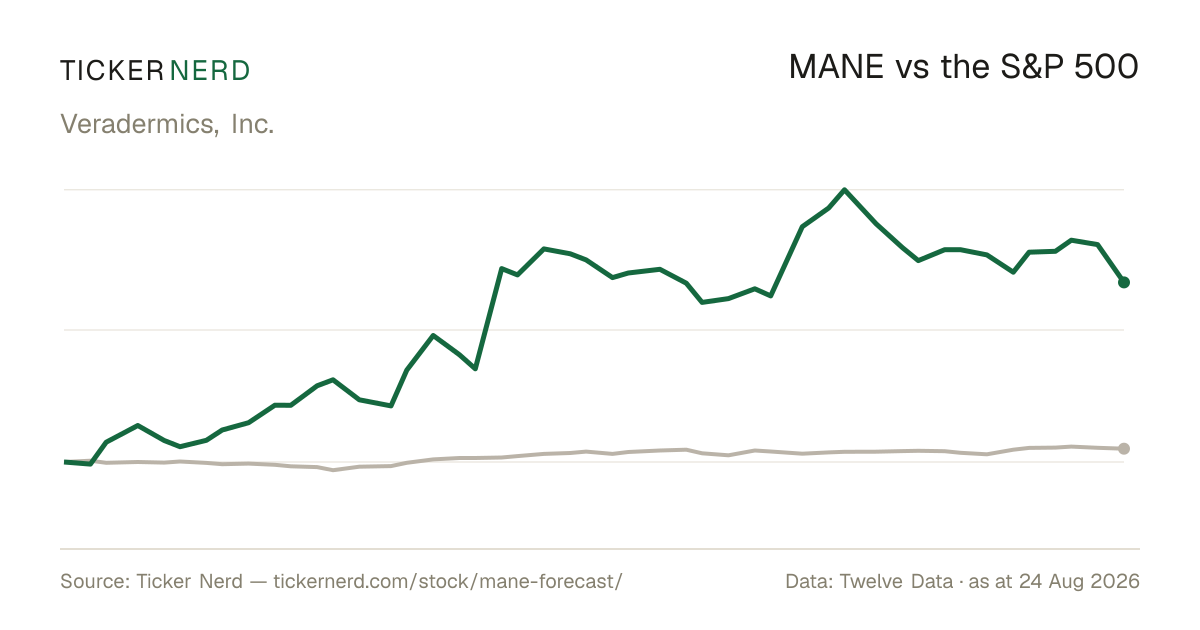
The 7 Wall Street analysts covering Veradermics, Inc. hold a median 12-month price target of $167 — +63.9% from the last close. Ticker Nerd's systematic factor model, run across ~4,600 US stocks, ranks it 1 of 100 as at 1 Aug 2026 — in the weakest quartile. The Street sees upside; the factor read is a caution. That gap is the story on this page.

Market cap
$4.4B
Ticker Nerd rank
1 / 100
Median analyst target
$167
Analysts covering
7
Total return, dividends reinvested
1W
−8.6%
1M
−21.5%
From high
−21.5%
From low
+175.2%
$37
$130
Range since 4 Feb 2026, adjusted closes · the dot is the last close
Ticker Nerd rank

MANE stock analysis: one number for the whole business

Consensus tells you what everyone already believes. The model scores Veradermics, Inc. on its factor families — the same systematic rank behind the Ticker Nerd portfolio.

Where the model ranks itAs at 1 Aug 2026
1 / 100

Percentile across ~4,600 US stocks on Ticker Nerd’s systematic factor model. Higher is better. How the model is built and tested

Revisions
33
Size
26
Momentum
23
Issuance
22
Value
14
Growth
8
Accruals
8
Quality
3
Volatility
3

Revisions (33): Analysts have, on balance, been raising their forecasts.

Volatility (3): The share price moves around a lot.

The rank is the raw material. Whether the rules would actually own Veradermics, Inc. — and when they’d sell — is the membership.

Wall Street

MANE stock forecast 2026-2027: analyst price targets & predictions

The bullish and bearish analyst opinions on MANE, reported as data — targets and ratings, the market's view beside the model's.

Share price and the analyst range, since 4 Feb 2026Adjusted close, US dollars
$50$100$150$200Mar 26Apr 26May 26Jun 26Jul 26Aug 26MANEHigh $182Median $167Low $135

Price targets and ratings are third-party analyst estimates, reported here as data. They are not Ticker Nerd forecasts, and they are frequently wrong.

What Wall Street says7 analysts
7 Buy0 Hold0 Sell
Low $135Median $167High $182

The green dot is the last close — the median target sits +63.9% from it.

Recent analyst actionsNewest first

Of the 13 most recent actions, 3 moved their price target up and 0 moved it down.

DateFirmActionRatingTarget
16 July 2026CitigroupMaintainsBuy$135$160
15 July 2026B. Riley SecuritiesInitiatesBuy$170
15 July 2026NeedhamMaintainsBuy$136$164
7 July 2026JefferiesMaintainsBuy
7 July 2026JefferiesMaintainsBuy$138$182
16 June 2026LifeSci CapitalInitiatesOutperform
2 June 2026NeedhamInitiatesBuy
18 May 2026CitigroupMaintainsBuy
22 Apr 2026Leerink PartnersMaintainsOutperform
2 Mar 2026Cantor FitzgeraldInitiatesOverweight
2 Mar 2026CitigroupInitiatesBuy
2 Mar 2026JefferiesInitiatesBuy
2 Mar 2026Leerink PartnersInitiatesOutperform

Price targets and ratings are third-party analyst estimates, reported here as data. They are not Ticker Nerd forecasts, and they are frequently wrong.

Estimates

MANE analyst estimate revisions

Not the forecast itself — the direction analysts are revising it. Revision direction is one of the model's factor families.

Which way the estimates are movingNext fiscal year
Analysts raising
0
Analysts cutting
1
Fundamentals

Veradermics, Inc. (MANE) financial data

A margin means little on its own. Each bar marks where the figure sits across the whole US universe we score.

Valuation
Trailing P/E
−52.5×

Cheaper than 98% of US stocks

Price / sales
Price / book
10.0×

Cheaper than 10% of US stocks

EV / EBITDA
−60.9×

Cheaper than 95% of US stocks

Growth & margins
Revenue growth (YoY)
Earnings growth (YoY)
Gross margin
Operating margin
0.0%

Higher than 35% of US stocks

Net margin
0.0%

Higher than 30% of US stocks

Returns & dividend
Return on equity
68.9%

Higher than 94% of US stocks

Return on assets
−54.6%

Higher than 7% of US stocks

Dividend yield

Bars mark the percentile across the ~4,600 US stocks Ticker Nerd covers, among those reporting the figure.

Peers

MANE vs competitors

The nearest names by industry and size, scored by the same model — like for like.

Its peer group, ranked by the same modelBiotechnology
CompanyMarket capTKN rank
MANEVeradermics, Inc.$4.4B
1
ACADACADIA Pharmaceuticals, Inc.$4.4B
65
TNGXTango Therapeutics, Inc.$4.4B
57
CAICaris Life Sciences, Inc.$4.4B
30
CELCCelcuity, Inc.$4.2B
28
EWTXEdgewise Therapeutics, Inc.$4.1B
52
CRSPCRISPR Therapeutics AG$4.6B
19
Market Radar

This page is one stock. Monday covers all of them.

Computed off the Friday close and sent before the US open.

Market Radar reports the week’s largest rank changes across roughly 4,600 US stocks, the factor behind each one, and where the market went. MANE appears on the weeks it earns a place.

Free, every Monday. Unsubscribe any time.

FAQ

Frequently asked questions about MANE stock

What is the MANE stock price forecast for 2026-2027?

The 7 Wall Street analysts covering Veradermics, Inc. have a median 12-month price target of $167, with estimates ranging from $135 to $182. These are third-party analyst estimates, not Ticker Nerd forecasts, and they are frequently wrong.

Is MANE stock a buy right now?

Of the 7 analysts covering Veradermics, Inc., 7 rate it a Buy, 0 a Hold and 0 a Sell. Ticker Nerd's systematic factor model ranks Veradermics, Inc. 1 out of 100 across roughly 4,600 US stocks as at 1 Aug 2026. None of this is personal advice — it does not consider your circumstances.

How does Ticker Nerd's model rank MANE?

As at 1 Aug 2026, Veradermics, Inc. ranks 1 out of 100 on Ticker Nerd's systematic factor model — a percentile across roughly 4,600 US stocks, built from its factor families. Its strongest factor family is Revisions (33 of 100).

Will MANE stock go up?

No one can know that. What the data says: the median 12-month target from 7 analysts implies +63.9% from the last close, and Ticker Nerd's factor model ranks Veradermics, Inc. 1 out of 100 as at 1 Aug 2026. Analyst targets are third-party estimates and frequently wrong; none of this is personal advice.

What is the MANE stock forecast for 2030?

No analyst covering Veradermics, Inc. publishes a 2030 price target — Wall Street targets run 12 to 18 months out. Sites quoting a 2030 price for MANE are extrapolating price history, which says nothing about the business. The furthest attributed numbers are the current analyst targets: $135 to $182 over the next 12 months.

What does Veradermics, Inc. do?

Veradermics Inc. is a dermatologist-founded, late clinical-stage biopharmaceutical company dedicated to developing innovative therapeutics for prevalent aesthetic and dermatological conditions.

Company

About Veradermics, Inc.

Veradermics Inc. is a dermatologist-founded, late clinical-stage biopharmaceutical company dedicated to developing innovative therapeutics for prevalent aesthetic and dermatological conditions. Its primary focus centers on pattern hair loss, affecting approximately 50 million men and 30 million women in the United States, where current treatments suffer from high dissatisfaction due to slow results, side effects, and inconvenient administration. The company's lead candidate, VDPHL01, represents an oral, non-hormonal, extended-release formulation of minoxidil, originally a hypertension drug noted for hair growth side effects. This proprietary design aims to optimize hair restoration by maximizing plasma concentrations for follicular benefits while minimizing cardiac risks associated with immediate-release versions. Veradermics is advancing VDPHL01 through a registration-directed clinical program, including fully enrolled Phase 2/3 trials in males and ongoing Phase 3 trials in females, targeting FDA approval via a 505(b)(2) New Drug Application. Founded in 2019 and headquartered in New Haven, Connecticut, Veradermics addresses a $9 billion U.S. market opportunity in hair loss treatments, backed by a seasoned team with deep dermatology expertise.

CEO Dr. Reid Waldman M.D. · 24 employees · United States · https://www.veradermics.com