 MTENIndustrials · Metal Fabrication
MTEN Stock Forecast: Mingteng International Corp., Inc. Price Predictions for 2026-2027
Ticker Nerd's systematic factor model, run across ~4,600 US stocks, ranks it 5 of 100 as at 3 Nov 2026 — in the weakest quartile.
MTEN stock analysis: one number for the whole business
Consensus tells you what everyone already believes. The model scores Mingteng International Corp., Inc. on its factor families — the same systematic rank behind the Ticker Nerd portfolio.
Percentile across ~4,600 US stocks on Ticker Nerd’s systematic factor model. Higher is better. How the model is built and tested
Size (97): Smaller than most of the companies we track.
Growth (1): Sales and profits are flat, shrinking, or growing more slowly than they were.
Built and run by Aslam Ghouse, an ex-Goldman Sachs systematic trader with 15+ years in markets.
MTEN stock forecast 2026-2027: analyst price targets & predictions
The bullish and bearish analyst opinions on MTEN, reported as data — targets and ratings, the market's view beside the model's.
Price targets and ratings are third-party analyst estimates, reported here as data. They are not Ticker Nerd forecasts, and they are frequently wrong.
Data provided by Twelve Data
Price targets and ratings are third-party analyst estimates, reported here as data. They are not Ticker Nerd forecasts, and they are frequently wrong.
This page is one stock. Monday covers all of them.
MTEN appears in the Radar on the weeks it earns a place.
- Market Radar, every Monday: the week's biggest rank moves across ~4,600 US stocks, and the reason for each.
- The AI build-out map, free: every AI company we track, part by part, and one part in full with each verdict.
AI cloud capacity
MSFTAMZNGOOGLORCL
AI chips
NVDAAVGOAMDMU
AI networking and serversIn full
ANETDELLLITECRDO
Data centre power
VRTCEGGEVVST
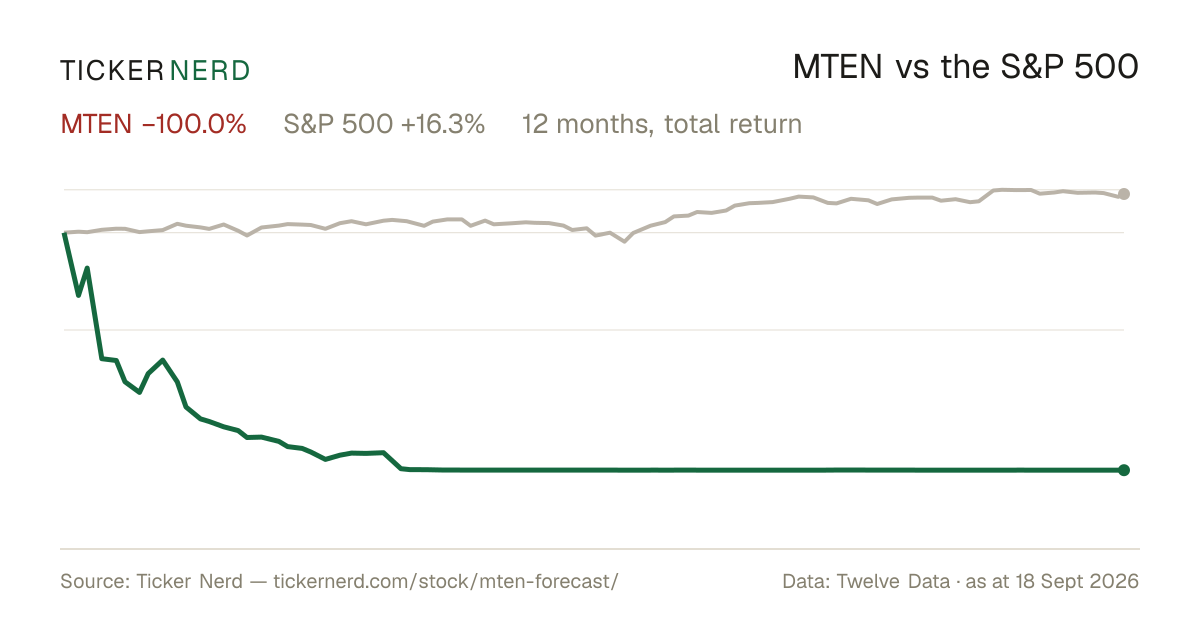
MTEN vs the S&P 500
Both lines are total return — dividends reinvested — so the comparison is honest on both sides.
Over the twelve months to 4 Nov 2026, Mingteng International Corp., Inc. returned −99.9% against +14.8% for the S&P 500, dividends included.
Download this chart as an image — free to reuse; link this page as the source.
Data provided by Twelve Data
MTEN analyst estimate revisions
Not the forecast itself — the direction analysts are revising it. Revision direction is one of the model's factor families.
Mingteng International Corp., Inc. (MTEN) financial data
A margin means little on its own. Each bar marks where the figure sits across the whole US universe we score.
- Trailing P/E
- 88.0×
- Price / sales
- 0.3×
- Price / book
- 0.0×
- EV / EBITDA
- 18.0×
Cheaper than 8% of US stocks
Cheaper than 84% of US stocks
Cheaper than 92% of US stocks
Cheaper than 8% of US stocks
- Revenue growth (YoY)
- 17.0%
- Earnings growth (YoY)
- —
- Gross margin
- —
- Operating margin
- −6.6%
- Net margin
- −15.3%
Higher than 65% of US stocks
Higher than 26% of US stocks
Higher than 17% of US stocks
- Return on equity
- −11.7%
- Return on assets
- −1.2%
- Dividend yield
- 0.0%
Higher than 35% of US stocks
Higher than 39% of US stocks
Higher than 1% of US dividend payers
Bars mark the percentile across the ~4,600 US stocks Ticker Nerd covers, among those reporting the figure.
Mingteng International Corp., Inc. (MTEN) statistics: revenue, profit & scale
The headline figures, each with its date. Every row carries its own link — cite it straight from here.
Mingteng International Corp., Inc. has a market value of $3.2M and an enterprise value of $3.3M.
Trailing P/E: 88.0×.
Forward dividend yield: 0.00%, paying out 0% of earnings.
Mingteng International Corp., Inc. employs 190 people.
Data provided by Twelve Data
MTEN vs competitors
The nearest names by industry and size, scored by the same model — like for like.
| Company | Market cap | TKN rank |
|---|---|---|
| MTENMingteng International Corp., Inc. | $3.2M | 5 |
| HIHOHighway Holdings Ltd. | $3.9M | 7 |
| TRSGTungray Technologies, Inc. | $19.0M | 6 |
| TPCSTechPrecision Corp. | $54.1M | 57 |
| HYFMHydrofarm Holdings Group, Inc.* | $3.1M | 37 |
| CDTGCDT Environmental Technology Investment Holdings Ltd.* | $3.4M | 14 |
| EHGOEshallgo, Inc.* | $3.0M | 59 |
* Nearest Industrials names by size — few metal fabrication companies of this scale trade in the US universe.
Look up any of the roughly 4,600 stocks we score.
The rank is the raw material. Whether the rules would actually own Mingteng International Corp., Inc. — and when they’d sell — is the membership. See the Ticker Nerd 20 →
Frequently asked questions about MTEN stock
How does Ticker Nerd's model rank MTEN?
As at 3 Nov 2026, Mingteng International Corp., Inc. ranks 5 out of 100 on Ticker Nerd's systematic factor model — a percentile across roughly 4,600 US stocks, built from its factor families. Its strongest factor family is Size (97 of 100).
What is the MTEN stock forecast for 2030?
No analyst covering Mingteng International Corp., Inc. publishes a 2030 price target — Wall Street targets run 12 to 18 months out. Sites quoting a 2030 price for MTEN are extrapolating price history, which says nothing about the business.
How has MTEN stock performed over the past year?
Mingteng International Corp., Inc. returned -99.9% over the 12 months to 4 Nov 2026, with dividends reinvested. Past performance does not indicate future returns.
What does Mingteng International Corp., Inc. do?
Mingteng International Corporation Inc. is an industrial company that develops and supplies automotive molds in China.
About Mingteng International Corp., Inc.
Mingteng International Corporation Inc. is an industrial company that develops and supplies automotive molds in China. The company focuses on casting molds used in turbocharger systems, braking systems, steering and differential systems, hydraulic parts, and other vehicle components. It also manufactures molds for new energy electric vehicle motor drive systems, battery pack systems, and engineering hydraulic components, serving applications across the automotive, construction machinery, and broader manufacturing industries. In addition to mold production, Mingteng International Corporation Inc. provides related services such as product design, repair, machining, and after-sale support. Based in Wuxi, China, and incorporated in 2021, the company operates as a specialized supplier within the industrial machinery and metal fabrication segment, supporting manufacturers that require precision tooling for complex automotive and industrial parts.
CEO Mr. Yingkai Xu · 190 employees · China · https://ir.wxmtmj.cn