 NGBasic Materials · Gold
NG Stock Forecast: NovaGold Resources, Inc. Price Predictions for 2026-2027
The 6 Wall Street analysts covering NovaGold Resources, Inc. hold a median 12-month price target of $13 — +107.0% from the last close. Ticker Nerd's systematic factor model, run across ~4,600 US stocks, ranks it 34 of 100 as at 27 Oct 2026 — in the lower half. The Street sees upside; the factor read is a caution. That gap is the story on this page.
NG stock analysis: one number for the whole business
Consensus tells you what everyone already believes. The model scores NovaGold Resources, Inc. on its factor families — the same systematic rank behind the Ticker Nerd portfolio.
Percentile across ~4,600 US stocks on Ticker Nerd’s systematic factor model. Higher is better. How the model is built and tested
Value (66): The shares cost little relative to the profits and assets behind them — which can mean the market is too gloomy, or that the business really is in trouble.
Growth (33): Sales and profits are flat, shrinking, or growing more slowly than they were.
Size (31): Larger than most of the companies we track — more scrutinised, less often mispriced.
Built and run by Aslam Ghouse, an ex-Goldman Sachs systematic trader with 15+ years in markets.
NG stock forecast 2026-2027: analyst price targets & predictions
The bullish and bearish analyst opinions on NG, reported as data — targets and ratings, the market's view beside the model's.
Price targets and ratings are third-party analyst estimates, reported here as data. They are not Ticker Nerd forecasts, and they are frequently wrong.
Data provided by Twelve Data
The green dot is the last close — the median target sits +107.0% from it.
| Date | Firm | Action | Rating | Target |
|---|---|---|---|---|
| 7 Oct 2026 | Morgan Stanley | Maintains | Overweight | — |
| 8 July 2026 | Morgan Stanley | Maintains | Overweight | — |
| 9 Apr 2026 | Morgan Stanley | Initiates | Overweight | — |
| 27 Mar 2026 | Canaccord Genuity | Initiates | Buy | — |
| 19 Mar 2026 | RBC Capital | Maintains | Outperform | — |
| 27 Jan 2026 | B. Riley Securities | Maintains | Buy | — |
| 15 Oct 2025 | Citigroup | Maintains | Buy | — |
| 30 Sept 2025 | B. Riley Securities | Maintains | Buy | — |
| 16 July 2025 | Citigroup | Initiates | Buy | — |
| 4 June 2025 | RBC Capital | Upgrade | Outperform | — |
| 21 June 2023 | B. Riley Securities | Reiterates | Buy | — |
| 25 Mar 2020 | B. Riley FBR | Maintains | Buy | — |
| 24 Mar 2020 | B. Riley FBR | Maintains | Buy | — |
| 24 Mar 2020 | B. Riley Securities | Maintains | Buy | — |
| 5 May 2018 | B. Riley FBR | Initiates | Buy | — |
| 24 Apr 2018 | JP Morgan | Maintains | Overweight | — |
| 19 Dec 2017 | B. Riley FBR | Initiates | Buy | — |
| 19 Dec 2017 | B. Riley Securities | Initiates | Buy | — |
| 27 Sept 2016 | JP Morgan | Upgrade | Overweight | — |
Price targets and ratings are third-party analyst estimates, reported here as data. They are not Ticker Nerd forecasts, and they are frequently wrong.
This page is one stock. Monday covers all of them.
NG appears in the Radar on the weeks it earns a place.
- Market Radar, every Monday: the week's biggest rank moves across ~4,600 US stocks, and the reason for each.
- The AI build-out map, free: every AI company we track, part by part, and one part in full with each verdict.
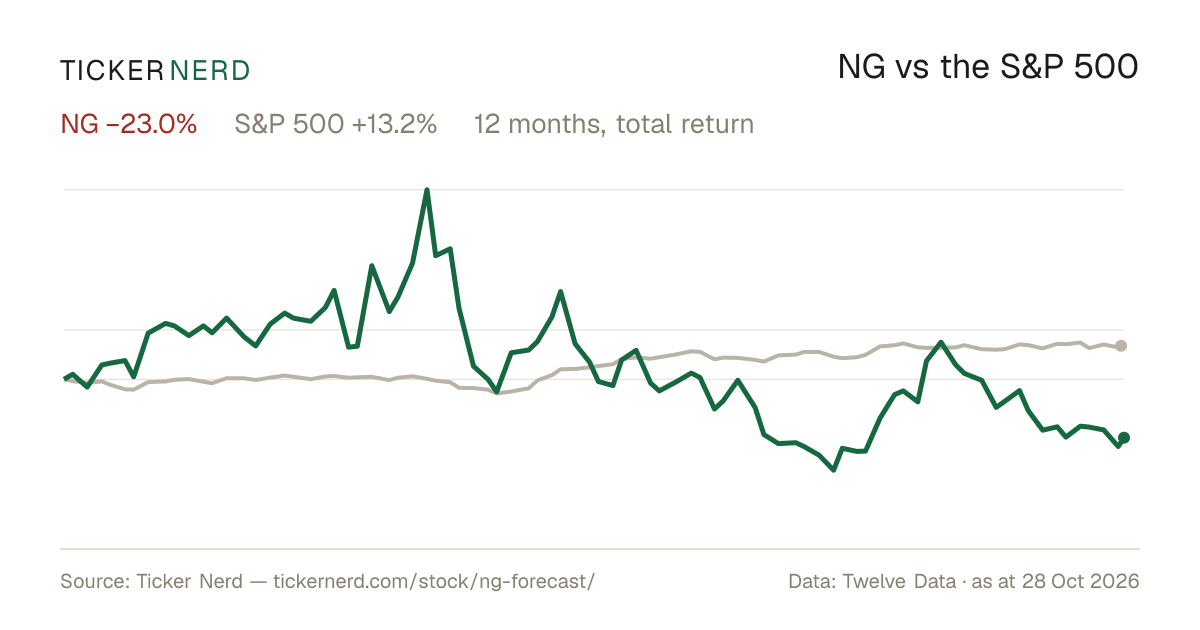
NG vs the S&P 500
Both lines are total return — dividends reinvested — so the comparison is honest on both sides.
Over the twelve months to 27 Oct 2026, NovaGold Resources, Inc. returned −22.0% against +13.5% for the S&P 500, dividends included.
Download this chart as an image — free to reuse; link this page as the source.
Data provided by Twelve Data
NG analyst estimate revisions
Not the forecast itself — the direction analysts are revising it. Revision direction is one of the model's factor families.
NovaGold Resources, Inc. (NG) financial data
A margin means little on its own. Each bar marks where the figure sits across the whole US universe we score.
- Trailing P/E
- −25.3×
- Price / sales
- —
- Price / book
- 7.2×
- EV / EBITDA
- −68.7×
Cheaper than 97% of US stocks
Cheaper than 14% of US stocks
Cheaper than 95% of US stocks
- Revenue growth (YoY)
- —
- Earnings growth (YoY)
- —
- Gross margin
- —
- Operating margin
- 0.0%
- Net margin
- 0.0%
Higher than 32% of US stocks
Higher than 30% of US stocks
- Return on equity
- −32.8%
- Return on assets
- −5.2%
- Dividend yield
- 0.0%
Higher than 26% of US stocks
Higher than 32% of US stocks
Higher than 1% of US dividend payers
Bars mark the percentile across the ~4,600 US stocks Ticker Nerd covers, among those reporting the figure.
NovaGold Resources, Inc. (NG) statistics: revenue, profit & scale
The headline figures, each with its date. Every row carries its own link — cite it straight from here.
NovaGold Resources, Inc. has a market value of $2.8B and an enterprise value of $2.6B.
Revenue in the twelve months to 31 May 2026: $0.0.
Net income over the same four quarters: −$72.2M.
Free cash flow in the twelve months to 31 May 2026: −$18.6M.
Trailing P/E: −25.3×; forward P/E: −31.5× — the forward figure prices analyst consensus estimates, not reported earnings.
Forward dividend yield: 0.00%, paying out 0% of earnings.
NovaGold Resources, Inc. employs 12 people.
Data provided by Twelve Data
NG vs competitors
The nearest names by industry and size, scored by the same model — like for like.
Look up any of the roughly 4,600 stocks we score.
The rank is the raw material. Whether the rules would actually own NovaGold Resources, Inc. — and when they’d sell — is the membership. See the Ticker Nerd 20 →
Frequently asked questions about NG stock
What is the NG stock price forecast for 2026-2027?
The 6 Wall Street analysts covering NovaGold Resources, Inc. have a median 12-month price target of $13, with estimates ranging from $12 to $14. These are third-party analyst estimates, not Ticker Nerd forecasts, and they are frequently wrong.
Is NG stock a buy right now?
Of the 6 analysts covering NovaGold Resources, Inc., 6 rate it a Buy, 0 a Hold and 0 a Sell. Ticker Nerd's systematic factor model ranks NovaGold Resources, Inc. 34 out of 100 across roughly 4,600 US stocks as at 27 Oct 2026. None of this is personal advice — it does not consider your circumstances.
How does Ticker Nerd's model rank NG?
As at 27 Oct 2026, NovaGold Resources, Inc. ranks 34 out of 100 on Ticker Nerd's systematic factor model — a percentile across roughly 4,600 US stocks, built from its factor families. Its strongest factor family is Value (66 of 100).
Will NG stock go up?
No one can know that. What the data says: the median 12-month target from 6 analysts implies +107.0% from the last close, and Ticker Nerd's factor model ranks NovaGold Resources, Inc. 34 out of 100 as at 27 Oct 2026. Analyst targets are third-party estimates and frequently wrong; none of this is personal advice.
What is the NG stock forecast for 2030?
No analyst covering NovaGold Resources, Inc. publishes a 2030 price target — Wall Street targets run 12 to 18 months out. Sites quoting a 2030 price for NG are extrapolating price history, which says nothing about the business. The furthest attributed numbers are the current analyst targets: $12 to $14 over the next 12 months.
How has NG stock performed over the past year?
NovaGold Resources, Inc. returned -22.0% over the 12 months to 27 Oct 2026, with dividends reinvested. Past performance does not indicate future returns.
What does NovaGold Resources, Inc. do?
NovaGold Resources Inc. is a gold exploration and development company focused on advancing mineral properties in the United States, with its core activity centered on the Donlin Gold project in Alaska.
About NovaGold Resources, Inc.
NovaGold Resources Inc. is a gold exploration and development company focused on advancing mineral properties in the United States, with its core activity centered on the Donlin Gold project in Alaska. The company’s business is concentrated on developing one of the industry’s most significant gold assets, supported by ownership in a joint venture structure that oversees permitting, technical studies, project optimization, community engagement, and other work related to project advancement. NOVAGOLD does not operate producing mines and instead serves as a development-stage participant in the precious metals sector, giving it a specialized role in the broader gold market. Headquartered in Vancouver, Canada, NovaGold Resources Inc. is positioned around a single principal asset and a focused business model built on long-term mineral project development.
CEO Mr. Gregory A. Lang · 12 employees · Canada · https://www.novagold.com