OPENOPENReal Estate · Real Estate Services

OPEN Stock Forecast: Opendoor Technologies, Inc. Price Predictions for 2026-2027

Last close, 11 Sept 2026
$2.79
−0.54% on the day

The 9 Wall Street analysts covering Opendoor Technologies, Inc. hold a median 12-month price target of $4.5 — +61.6% from the last close. Ticker Nerd's systematic factor model, run across ~4,600 US stocks, ranks it 16 of 100 as at 10 Sept 2026 — in the weakest quartile. The Street sees upside; the factor read is a caution. That gap is the story on this page.

Market cap
$2.7B
Ticker Nerd rank
16 / 100
Median analyst target
$4.50
Analysts covering
9
Revenue$883.0M−43.7% y/y
Operating income−$141.0M
Net income−$162.0M
Free cash flow−$723.0M
Quarterly, 8 quarters to 30 June 2026 · latest quarter's figure shown
Total return, dividends reinvested
1W
−11.0%
1M
−22.2%
YTD
−52.2%
1Y
−73.5%
From 52W high
−73.5%
From 52W low
0.0%
$3
$11
52-week range, adjusted closes · the dot is the last close
Ticker Nerd rank

OPEN stock analysis: one number for the whole business

Consensus tells you what everyone already believes. The model scores Opendoor Technologies, Inc. on its factor families — the same systematic rank behind the Ticker Nerd portfolio.

Where the model ranks itAs at 10 Sept 2026
16 / 100

Percentile across ~4,600 US stocks on Ticker Nerd’s systematic factor model. Higher is better. How the model is built and tested

Momentum
69
Issuance
65
Accruals
43
Size
32
Revisions
30
Value
28
Growth
26
Quality
7
Volatility
7

Momentum (69): The shares have been drifting up relative to others.

Volatility (7): The share price moves around a lot.

Built and run by Aslam Ghouse, an ex-Goldman Sachs quant trader with fourteen years in markets.

Wall Street

OPEN stock forecast 2026-2027: analyst price targets & predictions

The bullish and bearish analyst opinions on OPEN, reported as data — targets and ratings, the market's view beside the model's.

Share price and the analyst range, 12 monthsAdjusted close, US dollars
$0$2$4$6$8$10$12Oct 25Jan 26Apr 26Jul 26OPENHigh $8.00Median $4.50Low $1.00

Price targets and ratings are third-party analyst estimates, reported here as data. They are not Ticker Nerd forecasts, and they are frequently wrong.

Data provided by Twelve Data

What Wall Street says9 analysts
2 Buy5 Hold2 Sell
Low $1.00Median $4.50High $8.00

The green dot is the last close — the median target sits +61.6% from it.

Recent analyst actionsNewest first

Of the 20 most recent actions, 4 moved their price target up and 5 moved it down.

DateFirmActionRatingTarget
5 Aug 2026UBSMaintainsNeutral$5.00$4.50
13 July 2026Keefe, Bruyette & WoodsMaintainsUnderperform$2.25$2.65
28 Apr 2026Alliance Global PartnersInitiatesBuy$8.00
12 Nov 2025CitigroupMaintainsSell$0.70$1.40
10 Nov 2025Keefe, Bruyette & WoodsMaintainsUnderperform$1.00$2.00
13 Aug 2025Keefe, Bruyette & WoodsDowngradeUnderperform$1.00
7 Aug 2025Zelman & AssocDowngradeUnderperform$1.00
6 Aug 2025CitigroupDowngradeSell$0.70
6 Aug 2025UBSMaintainsNeutral$1.30$1.60
4 Mar 2025UBSMaintainsNeutral$2.00$1.20
3 Mar 2025Keefe, Bruyette & WoodsMaintainsMarket Perform$1.90$1.55
28 Feb 2025CitigroupMaintainsNeutral$1.80$1.40
3 Jan 2025CitigroupMaintainsNeutral$2.00$1.80
16 Dec 2024JMP SecuritiesReiteratesMarket Outperform$2.50
6 Aug 2024Deutsche BankMaintainsHold
2 Aug 2024JMP SecuritiesMaintainsMarket Outperform
14 May 2024UBSMaintainsNeutral
3 May 2024JMP SecuritiesMaintainsMarket Outperform
12 Apr 2024JMP SecuritiesReiteratesMarket Outperform
16 Feb 2024JMP SecuritiesMaintainsMarket Outperform

Price targets and ratings are third-party analyst estimates, reported here as data. They are not Ticker Nerd forecasts, and they are frequently wrong.

Market Radar

This page is one stock. Monday covers all of them.

Computed off the Friday close and sent before the US open.

Market Radar reports the week’s largest rank changes across roughly 4,600 US stocks, the factor behind each one, and where the market went. OPEN appears on the weeks it earns a place.

Free, every Monday. Unsubscribe any time.

Performance

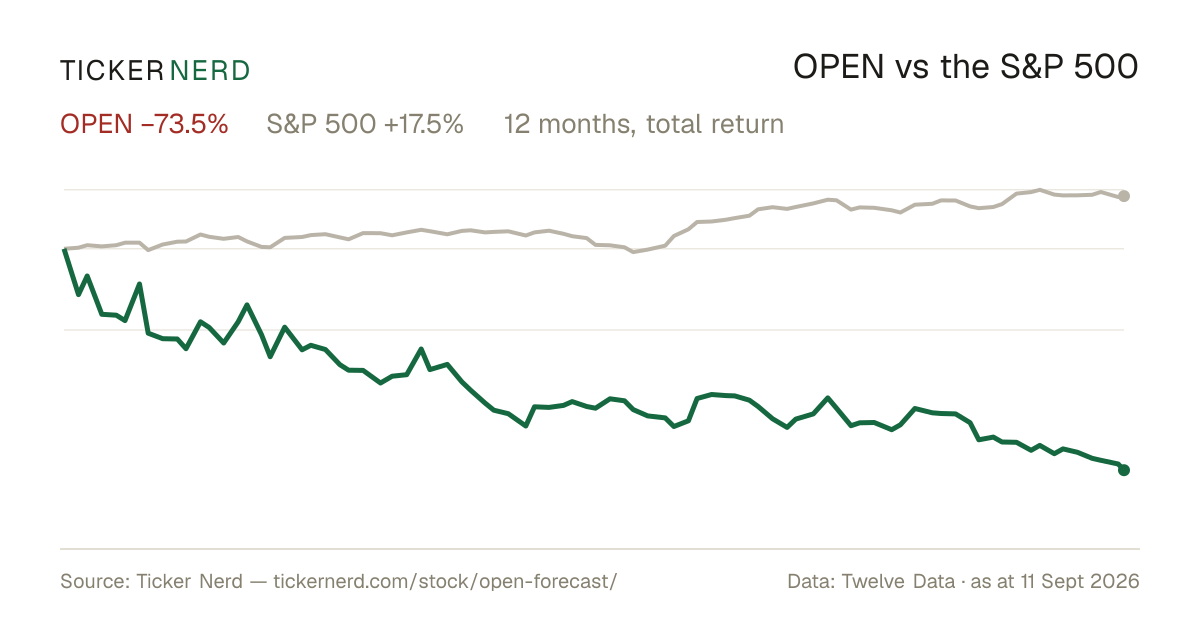
OPEN vs the S&P 500

Both lines are total return — dividends reinvested — so the comparison is honest on both sides.

Over the twelve months to 11 Sept 2026, Opendoor Technologies, Inc. returned −73.5% against +17.5% for the S&P 500, dividends included.

OPEN vs S&P 500, last 12 monthsTotal return, rebased to 100
20406080100120Oct 25Jan 26Apr 26Jul 26OPENS&P 500

Download this chart as an image — free to reuse; link this page as the source.

Data provided by Twelve Data

Estimates

OPEN analyst estimate revisions

Not the forecast itself — the direction analysts are revising it. Revision direction is one of the model's factor families.

Which way the estimates are movingNext fiscal year
Analysts raising
1
Analysts cutting
3
Fundamentals

Opendoor Technologies, Inc. (OPEN) financial data

A margin means little on its own. Each bar marks where the figure sits across the whole US universe we score.

Valuation
Trailing P/E
−1.6×

Cheaper than 84% of US stocks

Price / sales
0.8×

Cheaper than 73% of US stocks

Price / book
3.0×

Cheaper than 33% of US stocks

EV / EBITDA
−8.4×

Cheaper than 83% of US stocks

Growth & margins
Revenue growth (YoY)
−43.7%

Higher than 6% of US stocks

Earnings growth (YoY)
−43.7%

Higher than 12% of US stocks

Gross margin
9.7%

Higher than 9% of US stocks

Operating margin
−15.9%

Higher than 23% of US stocks

Net margin
−46.7%

Higher than 11% of US stocks

Returns & dividend
Return on equity
−196.9%

Higher than 7% of US stocks

Return on assets
−10.9%

Higher than 26% of US stocks

Dividend yield

Bars mark the percentile across the ~4,600 US stocks Ticker Nerd covers, among those reporting the figure.

Key statistics

Opendoor Technologies, Inc. (OPEN) statistics: revenue, profit & scale

The headline figures, each with its date. Every row carries its own link — cite it straight from here.

  • Opendoor Technologies, Inc. has a market value of $2.7B and an enterprise value of $4.0B.

  • Revenue in the twelve months to 30 June 2026: $3.3B. The latest quarter shrank 43.7% year on year.

  • Net income over the same four quarters: −$1.5B, a −46.7% net margin.

  • Diluted earnings per share, trailing twelve months: $−1.73.

  • Free cash flow in the twelve months to 30 June 2026: −$474.0M.

  • Shares outstanding: 968.6M.

  • Trailing P/E: −1.6×; forward P/E: −59.3× — the forward figure prices analyst consensus estimates, not reported earnings.

  • Opendoor Technologies, Inc. employs 1,042 people $3.1M of revenue per employee.

Statement figures: company filings via Twelve Data, four quarters to 30 June 2026 · market figures as at 11 Sept 2026

Data provided by Twelve Data

Peers

OPEN vs competitors

The nearest names by industry and size, scored by the same model — like for like.

Its peer group, ranked by the same modelReal Estate Services
CompanyMarket capTKN rank
OPENOpendoor Technologies, Inc.$2.7B
16
NMRKNewmark Group, Inc.$2.6B
90
IHSIHS Holding Ltd.$2.8B
79
CWKCushman & Wakefield Ltd.$3.0B
58
MMIMarcus & Millichap, Inc.$1.2B
95
HBNBHotel101 Global Holdings Corp.$1.2B
10
COMPCompass, Inc. (New York)$7.8B
36

Look up any of the roughly 4,600 stocks we score.

The rank is the raw material. Whether the rules would actually own Opendoor Technologies, Inc. — and when they’d sell — is the membership. See the Ticker Nerd 20 →

News

Latest OPEN news & analysis

US CPI today: 5 stocks that could explode if inflation delivers a surprise

Invezz · 11 Sept 2026neutral

The article reports that Wall Street is awaiting Friday's CPI report, which could determine whether the Federal Reserve raises interest rates next week. August CPI is expected to rise 0.4% from July and 3.4% from a year earlier, with core inflation forecast at 0.2% monthly and 2.4% annually, and it highlights five stocks that could see significant moves if inflation delivers a surprise.

Why it matters — An OPENDoor watcher would care because the CPI reading and the Fed's rate decision directly influence mortgage rates and housing demand, which are central to Opendoor's business.

Opendoor Sinks 7% as Yield Spike Meets Delayed Profit Timeline, Offerpad and Zillow Group Trail

24/7 Wall Street · 10 Sept 2026negative

Opendoor Technologies' stock fell 7% to $2.79 in early Thursday trading, extending a decline that has shares down 51% year to date. The move follows a yield spike and a delayed profit timeline, with peers Offerpad and Zillow Group also trailing.

Why it matters — This item signals continued downward pressure on Opendoor's share price amid macroeconomic headwinds and a pushed-back path to profitability.

Opendoor Home Loans Exits Beta With Fixed- and Adjustable-Rate Mortgages

GlobeNewsWire · 4 Sept 2026neutral

Opendoor Home Loans has exited its beta phase and now offers 30-, 20-, and 15-year fixed-rate mortgages, as well as 5/6, 7/6, and 10/6 adjustable-rate mortgages, for any home purchase in markets where the service is licensed.

Why it matters — Opendoor's expansion of its mortgage product lineup beyond beta could broaden the financing options available to home buyers engaging with the company's platform.

Offerpad Rallies 7%, Opendoor Edges Higher: Is Rate Relief Reaching the iBuyers?

24/7 Wall Street · 2 Sept 2026neutral

Rate-sensitive housing stocks, including iBuyers Offerpad and Opendoor, moved higher while homebuilders barely changed. The iShares U.S. Home Construction ETF rose 0.7% to $92, as investors weighed the possibility of mortgage rate relief reaching the iBuying sector.

Why it matters — Because Opendoor is one of the most rate-sensitive companies in housing, any signs of mortgage rate relief that boost iBuyer sentiment are directly relevant to its outlook.

Should You Avoid Opendoor Stock, Even at a 52-Week Low?

The Motley Fool · 1 Sept 2026neutral

Opendoor made progress in the second quarter, with higher revenue quarter over quarter and lower costs per acquisition. However, revenue and net loss were worse compared with the same period last year.

Why it matters — The quarterly results give OPEN watchers a mixed picture of sequential operational improvement alongside weaker year-over-year financials.

FAQ

Frequently asked questions about OPEN stock

What is the OPEN stock price forecast for 2026-2027?

The 9 Wall Street analysts covering Opendoor Technologies, Inc. have a median 12-month price target of $4.5, with estimates ranging from $1 to $8. These are third-party analyst estimates, not Ticker Nerd forecasts, and they are frequently wrong.

Is OPEN stock a buy right now?

Of the 9 analysts covering Opendoor Technologies, Inc., 2 rate it a Buy, 5 a Hold and 2 a Sell. Ticker Nerd's systematic factor model ranks Opendoor Technologies, Inc. 16 out of 100 across roughly 4,600 US stocks as at 10 Sept 2026. None of this is personal advice — it does not consider your circumstances.

How does Ticker Nerd's model rank OPEN?

As at 10 Sept 2026, Opendoor Technologies, Inc. ranks 16 out of 100 on Ticker Nerd's systematic factor model — a percentile across roughly 4,600 US stocks, built from its factor families. Its strongest factor family is Momentum (69 of 100).

Will OPEN stock go up?

No one can know that. What the data says: the median 12-month target from 9 analysts implies +61.6% from the last close, and Ticker Nerd's factor model ranks Opendoor Technologies, Inc. 16 out of 100 as at 10 Sept 2026. Analyst targets are third-party estimates and frequently wrong; none of this is personal advice.

What is the OPEN stock forecast for 2030?

No analyst covering Opendoor Technologies, Inc. publishes a 2030 price target — Wall Street targets run 12 to 18 months out. Sites quoting a 2030 price for OPEN are extrapolating price history, which says nothing about the business. The furthest attributed numbers are the current analyst targets: $1 to $8 over the next 12 months.

How has OPEN stock performed over the past year?

Opendoor Technologies, Inc. returned -73.5% over the 12 months to 11 Sept 2026, with dividends reinvested. Past performance does not indicate future returns.

What does Opendoor Technologies, Inc. do?

Opendoor Technologies Inc. is a technology-enabled real estate company that provides a digital platform for residential property transactions in the United States.

What is the latest news on OPEN?

The most recent item we track (Invezz, 11 Sept 2026): "US CPI today: 5 stocks that could explode if inflation delivers a surprise". The article reports that Wall Street is awaiting Friday's CPI report, which could determine whether the Federal Reserve raises interest rates next week. August CPI is expected to rise 0.4% from July and 3.4% from a year earlier, with core inflation forecast at 0.2% monthly and 2.4% annually, and it highlights five stocks that could see significant moves if inflation delivers a surprise.

Company

About Opendoor Technologies, Inc.

Opendoor Technologies Inc. is a technology-enabled real estate company that provides a digital platform for residential property transactions in the United States. Opendoor Technologies Inc. lets homeowners sell their homes directly through online cash-offer products and also supports home purchases and resales through a managed marketplace model. The company’s services include brokerage, title insurance and settlement, escrow, property and casualty insurance, real estate licensing, and construction-related support. Its platform is designed to simplify the home transaction process for consumers by combining software, data science, and operational capabilities in one end-to-end service. Opendoor Technologies Inc. serves the residential housing market, where it plays a role as a digital intermediary between sellers, buyers, and other real estate participants. Founded in 2013 and based in Tempe, Arizona, Opendoor Technologies Inc. focuses on making residential real estate transactions more streamlined and accessible through technology.

CEO Mr. Kasra Nejatian · 1,042 employees · United States · https://www.opendoor.com